
TreePlotter™ Projects combines inventory and canopy data to provide a solution for urban forestry management. The module enables project-specific tracking, canopy cover goals, and reporting. Projects organizes data at various geographic scales supporting visualization of planting areas and prioritization of projects.
Topics Covered in this Tutorial:
- Why use TreePlotter Projects?
- Geographic Scales
- Automations
- Work Tracking
- Workflow
- Known Limitations
Why use TreePlotter Projects?
TreePlotter Projects addresses the need for a centralized project management, efficient data handling, and visualization tool for grant reporting and progress tracking. The Projects add-on simplifies data entry, offers shareable maps, and aligns with grant compliance standards. These features help users demonstrate project impacts and secure additional funding. Projects can be used for one-time planting efforts or recurring events to track plantings and other activities over multiple years to monitor progress towards the canopy cover target set for that area.
Geographic Scales
TreePlotter Projects includes two geographic scales that are installed in your TreePlotter app: Priority Areas and Projects. Both layers will include tabs and data fields for general details, tree canopy and land cover metrics, user-defined canopy cover targets, and automatically generated tree planting counts based on your tree inventory data and activities.
A hierarchy is automatically built into TreePlotter Projects, meaning you can click a Priority Area and then “Load” the Projects within it, or similarly, click a Project and “Load” the tree points within it. This hierarchy organizes the data across geographic scales, applies a filter for reports and dashboard stats, and automatically counts the number of trees and projects by their status.
Priority Areas
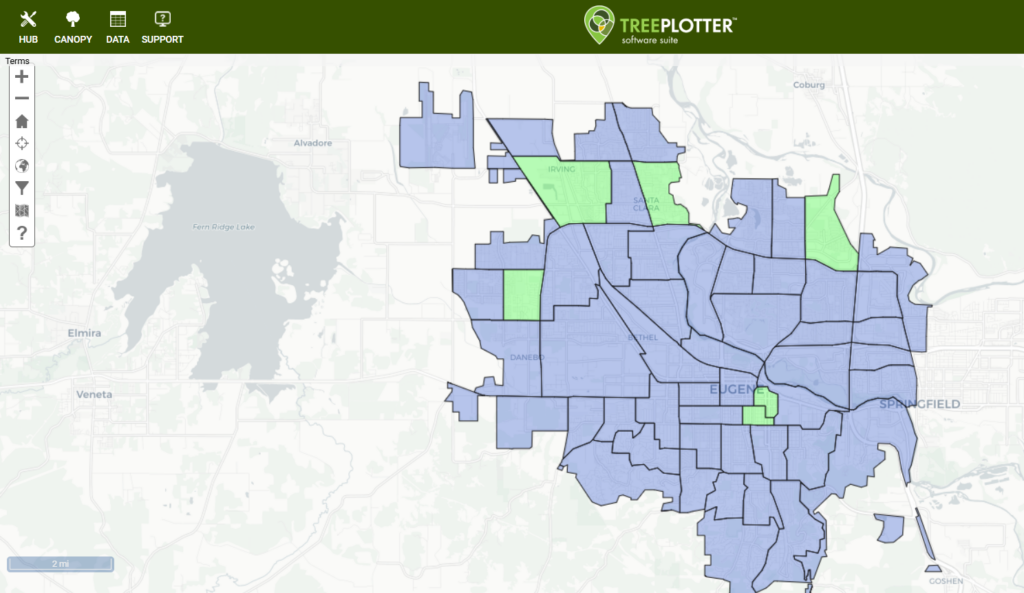
This is a census polygon layer pulled from Census Tract Boundaries and uploaded into TreePlotter as an “editable” map database. The counts of projects and trees planted are automatically joined to Priority Areas. It provides a community-wide view to present and share where your community is investing in greening initiatives over time. You can establish and track tree canopy cover goals, based on aggregating all of the Trees and Projects into each respective Priority Area.
Example of Priority Areas
Projects
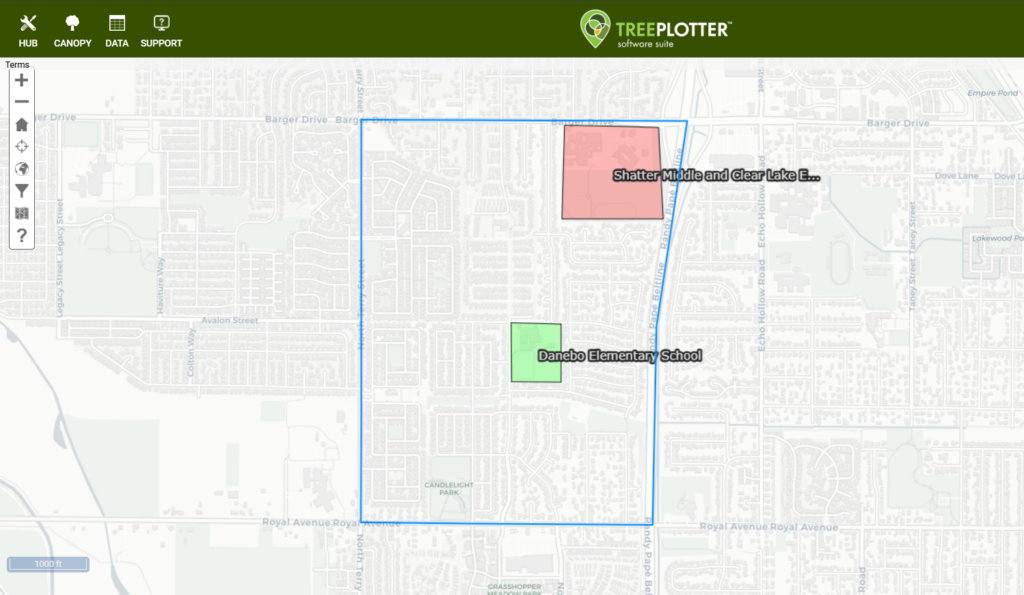
This is a polygon boundary created by hand-drawing the extent of individual project areas. It includes data fields for the site and type of work, project management, and fields to establish and track tree canopy cover goals. Existing inventoried trees, proposed sites, and new tree planting sites are automatically joined (spatially) by Status and summarized to the Project.
Example of Project Areas within a Priority Area
Trees
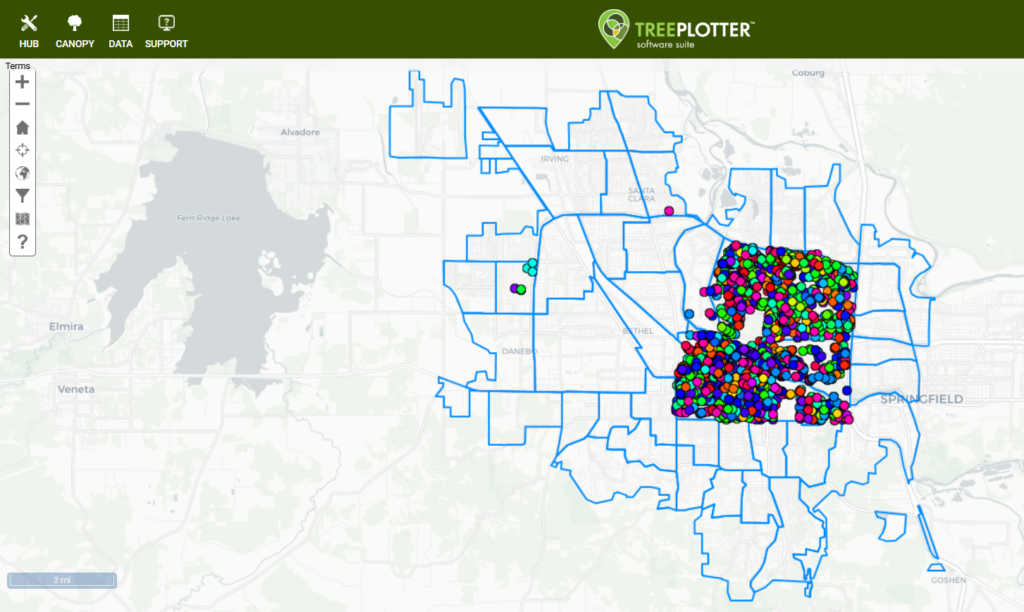
Existing trees that have been inventoried using TreePlotter INVENTORY can be loaded into a Project.
Example of Inventoried Trees layer
Automations
- A hierarchy is automatically built into TreePlotter Projects, meaning you can click a Priority Area and then “Load” the Projects within it, or similarly, click a Project and “Load” the tree points within it. This hierarchy organizes the data across geographic scales, applies a filter for reports and dashboard stats, and automatically counts the number of trees and projects by their status.
- Existing inventoried trees, proposed sites, and new tree planting sites are automatically spatially joined by Status and summarized to the Project Area.
- Goal creation and tracking: trees to plant, canopy cover to reach, etc. with progress summarized automatically per Project Area.
Workflow
Select a Priority Area
Priority Areas can be viewed by navigating to your TreePlotter application and ensuring the Priority Areas reference layer is on. Priority Areas will be shown on the map by blue or green polygons. Blue polygons represent Inactive Priority Areas while green polygons represent Active Priority Areas. Clicking on a polygon will display a pop-up window with the Census Tract or Block Group information for the polygon. The Details button in the pop-up window will allow the user to edit the Priority Area details.

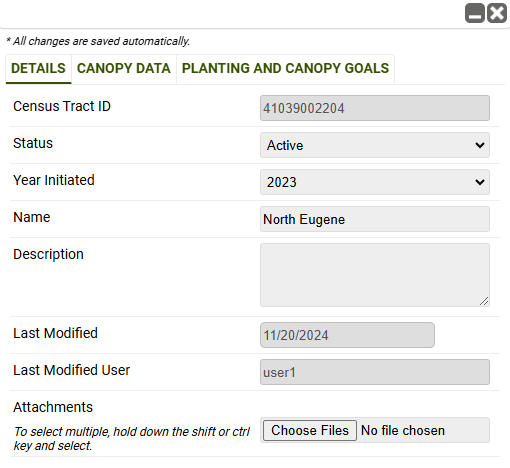
Edit Priority Area Details – Details tab
The Priority Area Details tab allows the user to edit particular data fields like the project Status, Year Initiated, Name, and Description of the Priority Area. The Details tab also displays other information like the Census Tract ID, Last Modified Date and User, as well as any uploaded attachments.
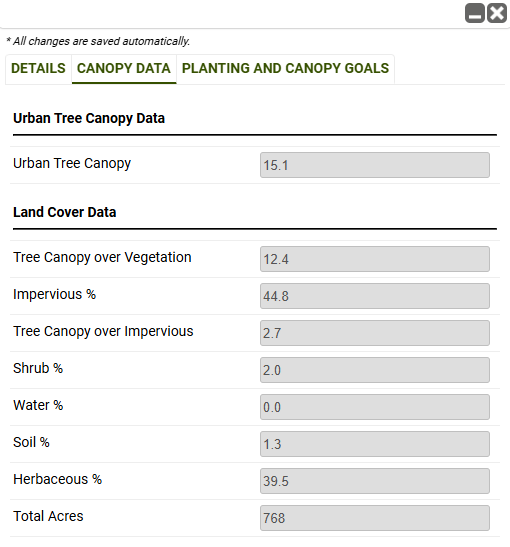
Edit Priority Area Details – Canopy Data tab
The Priority Area Canopy Data tab displays landcover metrics for the selected Priority Area like Urban Tree Canopy, Tree Canopy over Vegetation, percentage of impervious surfaces, among others. These metrics are pulled from the CANOPY module of the application and cannot be modified.
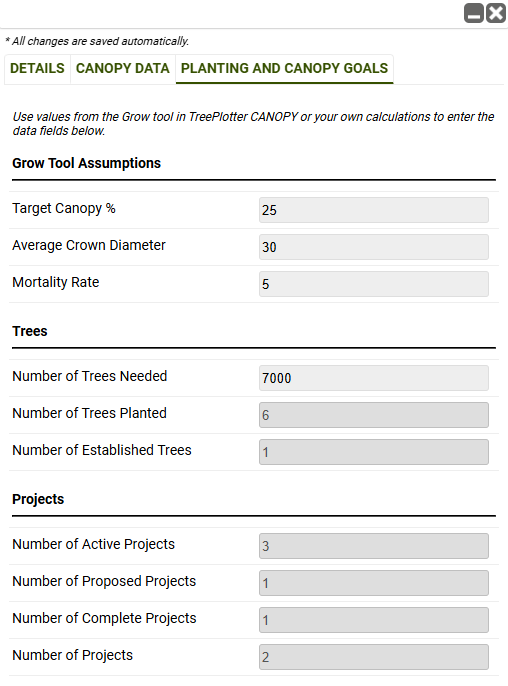
Edit Priority Area Details – Planting and Canopy Goals tab
The Priority Area Planting and Canopy Goals tab allows the user to edit particular data fields like Target Canopy Percentage, Average Crown Diameter, Mortality Rate, and Number of Trees Needed to define Project Area canopy goals. The Planting and Canopy Goals tab also displays other Priority Area metrics like Active Projects, Proposed Projects, Complete Projects, and Overall Projects totals.
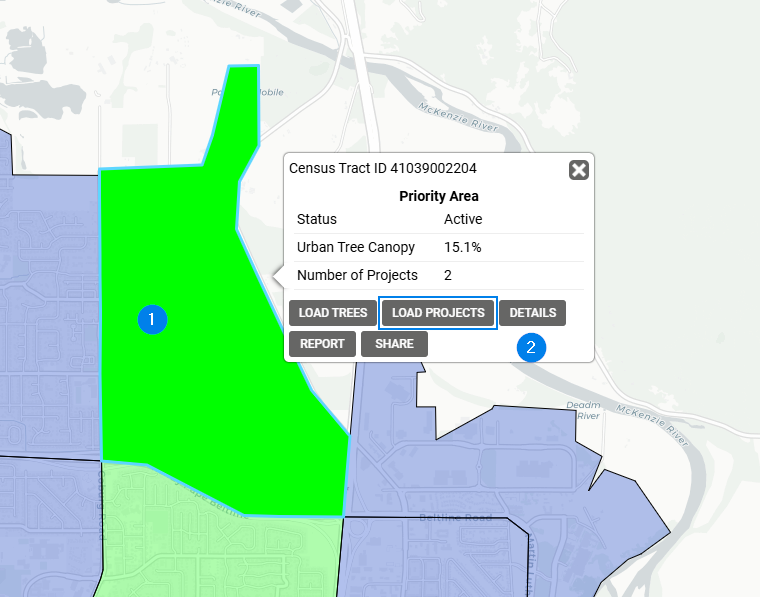
Load Projects
To load a Project within a Priority Area, the user will select the Priority Area of interest (1) and then click the ‘Load Projects’ button (2) to load all Projects in the Priority Area. Projects will appear as colored polygons according to the Project Status field found in the Project Details tab. If a Project(s) does not appear after clicking the ‘Load Projects’ button, no Projects exist and the Legend will display “No Projects”. A new project area will need to be drawn.
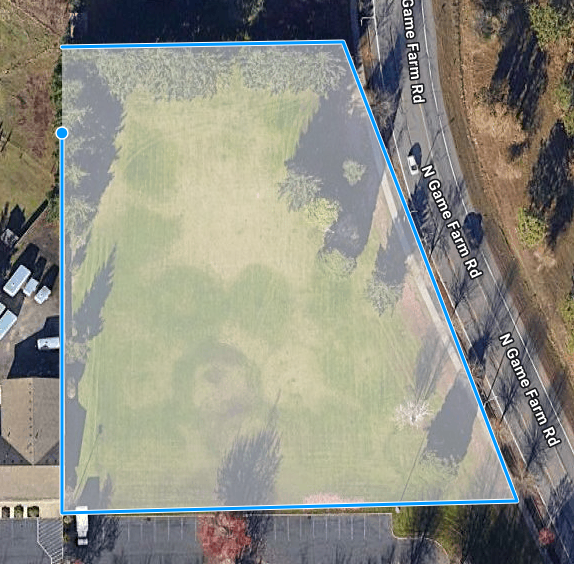
Draw Project Area
Project Areas are added by the user through a drawing tool. When in a Priority Area, Projects can be drawn on the map by using the ‘Add’ button to open the Project Area draw tool. The Project Area boundary can be defined by clicking on the map to draw successive line segments delineating the desired boundary. Once the polygon is a closed shape, the Project Details popup will appear for editing.
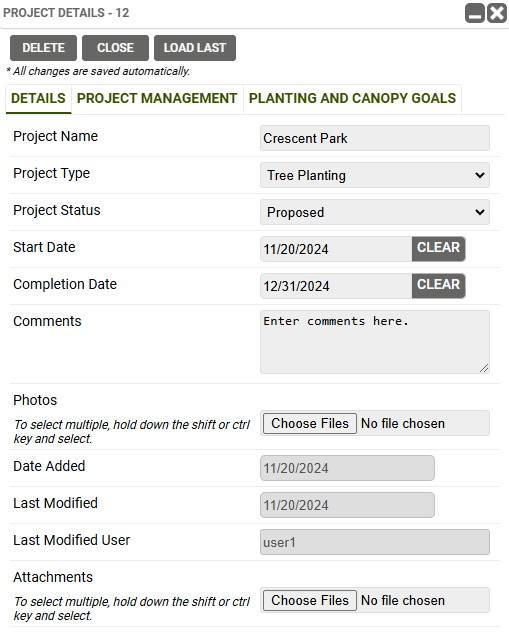
Edit Project Area Details – Details tab
The Project Area Details tab allows the user to edit particular Project data fields like the Name, Type, Status, Start/Completion Dates, and add photos or attachments. The tab also displays other Project Area metrics like the date the project was added, when the project was last modified, and by whom the project was last modified.
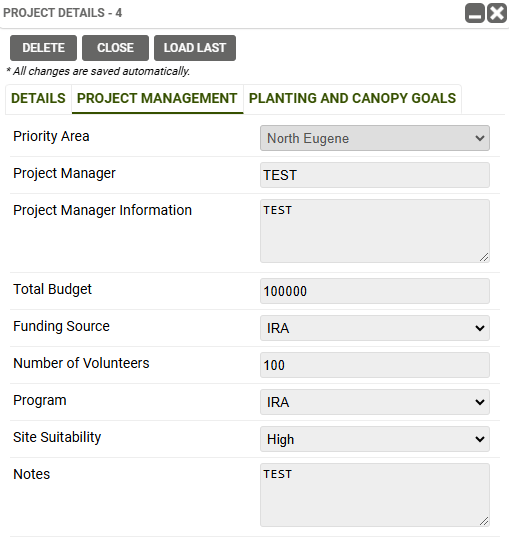
Edit Project Area Details – Project Management tab
The Project Area Project Management tab allows the user to edit particular Project data fields like the name and information associated with the Project Manager, project budget, funding source for the project, number of volunteers needed for project support, if the project is part of a program, notes about the project, and the site suitability for tree plantings in the Project Area. The tab also displays the Priority Area that is associated with the Project Area.
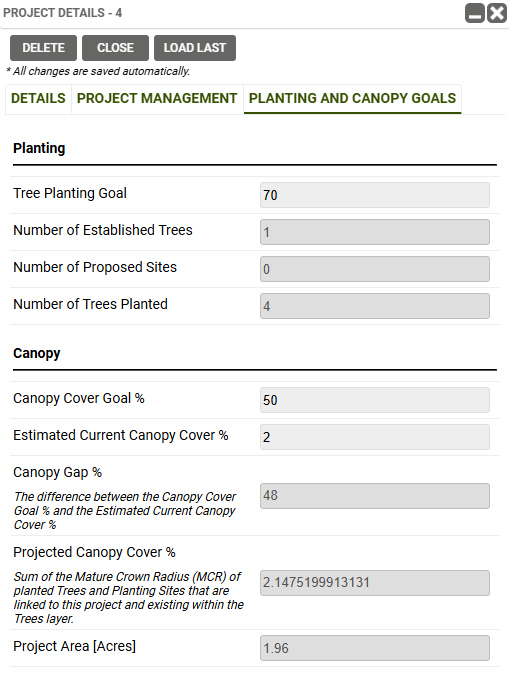
Edit Project Area Details – Planting and Canopy Goals tab
The Project Area Planting and Canopy Goals tab allows the user to edit particular Project data fields like the number of trees to plant for the tree planting goal, the amount of desired canopy coverage, and estimated current canopy coverage. The tab also displays a variety of metrics including established tree counts, proposed site counts, number of trees planted, the canopy gap percentage, projected canopy cover percentage, and the acreage of the Project Area.
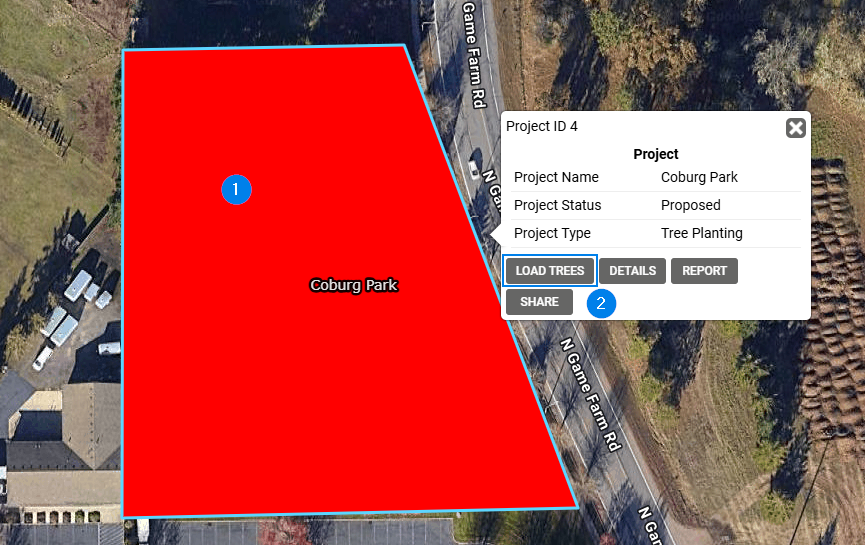
Load Trees
Trees associated with a Project Area can be loaded onto the map by clicking on the desired Project Area polygon (1). Once the desired Project Area has been selected, the Project Area popup window will be displayed (2). To load trees into the Project Area, click the ‘Load Trees’ button. All the trees associated with the Project Area will be loaded into the polygon. Any new trees added to the Project Area will be automatically assigned to this Project Area.
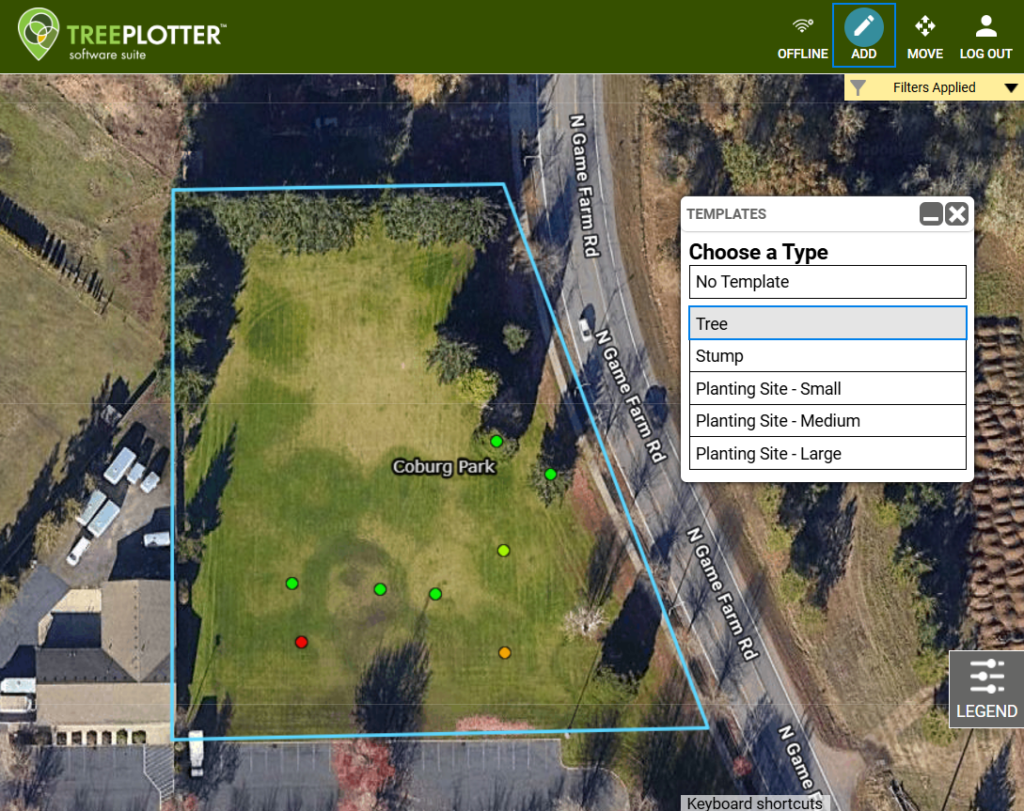
Add Proposed Planting Sites
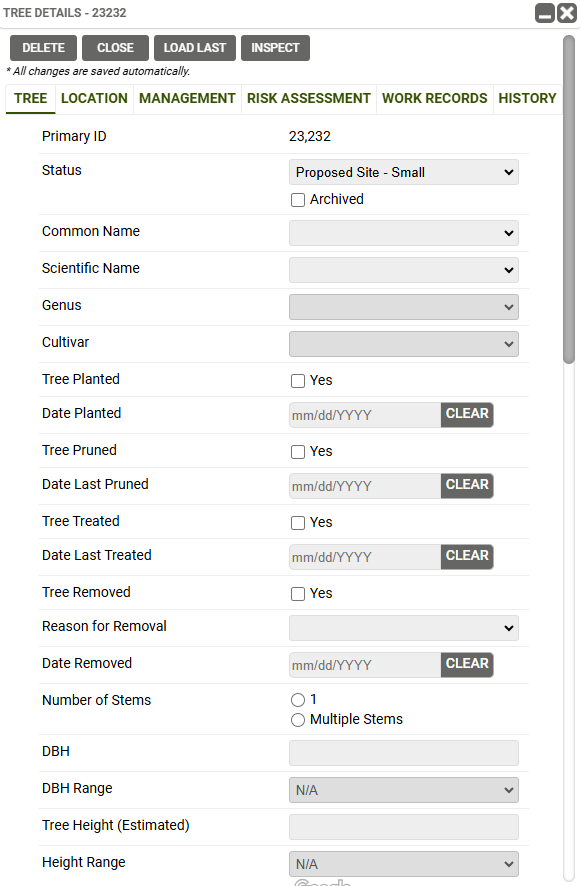
After loading trees into a Project Area, proposed planting locations can be added to the Project Area. The ‘Add’ button will display the planting site template and will provide a choice of small, medium, or large sites. The planting site templates come with a number of prepopulated data fields including Status (prepopulated with the site size), Project (the name associated with the Project Area, and Mature Crown Diameter in feet. The difference between the site sizes is that the Mature Crown Diameter field will prepopulate with “10” (feet) for Small planting sites, “20” (feet) for Medium planting sites, and “30” (feet) for Large planting sites.
Once a tree template is selected, the Add method popup window will display. We recommend selecting the By Map add method for best control over point placement on the map. Click a location on the map to add a planting site and open the Tree Details popup. Fill out the form with the desired information and close the form to add the proposed site.
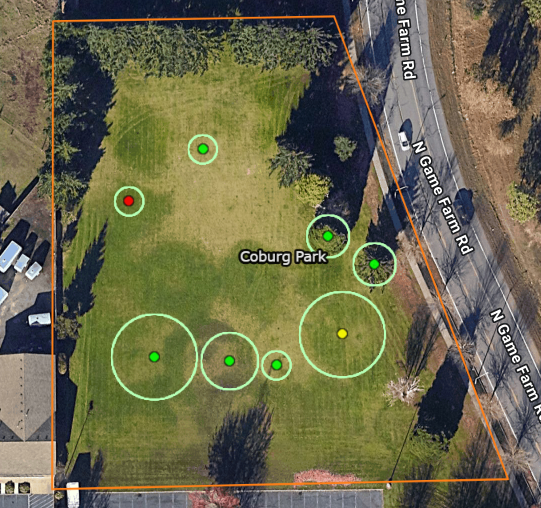
Proposed Planting Site Selection Enhancement
Planting site selection can be enhanced in Projects by using the the Symbology in the Legend to show the Mature Crown Diameter (feet). Mature Crown Diameter symbology can be viewed by selecting the “Mature Crown Diameter (ft)” option in the Symbology dropdown list. With this symbology selected, a light green boundary will appear around each point which depicts the “Mature Crown Diameter (ft)” of the point. Review the map symbology to ensure adequate crown spacing at maturity for proposed plantings within the Project Area (orange) boundary. The Move tool can be used to move proposed sites, if needed.
Plant Trees
Work Records (WRS) can be added to the Proposed Site(s) to schedule and track planting efforts and to update tree details. WRS can also be used to schedule and track the activities related to pruning, Plant Health Care (PHC), and removal. These workflows are considered in the following section, Work Tracking.

Add Trees
Project Areas may have existing trees that need to be inventoried and managed. Existing trees can be added to a Project Area through the ‘Add’ button. Once the add feature is engaged, select the Tree option in the Template popup window, and select the By Map Add Method in the following popup window. We recommend selecting the By Map add method for best control over point placement on the map. Select the desired location on the map to place a tree point. Fill out the Tree Details form with the desired information and close the form to add the tree point.
When a tree is added within the Project Area boundary, the Project data field will prepopulate with the Project name. This automation connects the tree to the Project Area and Priority Area.
Work Tracking
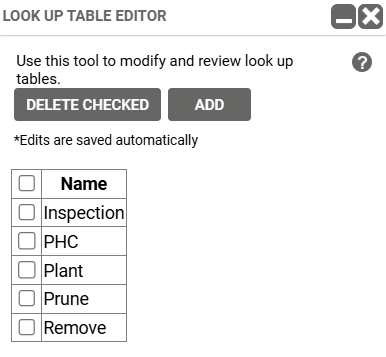
Work tracking is accomplished through the use of the Work Records (WRS) tool to schedule and track work activities associated with any tree. WRS are managed through the Work Records / Work History Data table; individual records are displayed for work tasks associated with each tree. The Work Categories and Work Tasks Look Up Tables in the Data Tools Hub menu control the various work categories (e.g. PHC, Plant, Prune, etc.) and work tasks (e.g. Fertilize-Fall, Water, Crown Clean) available for selection in WRS. These Tables are editable with the default lists shown below.
Work Categories Lookup Table
The Work Categories Lookup Table contains common work categories. New work categories can be added to the Lookup table by clicking the ‘Add’ button.
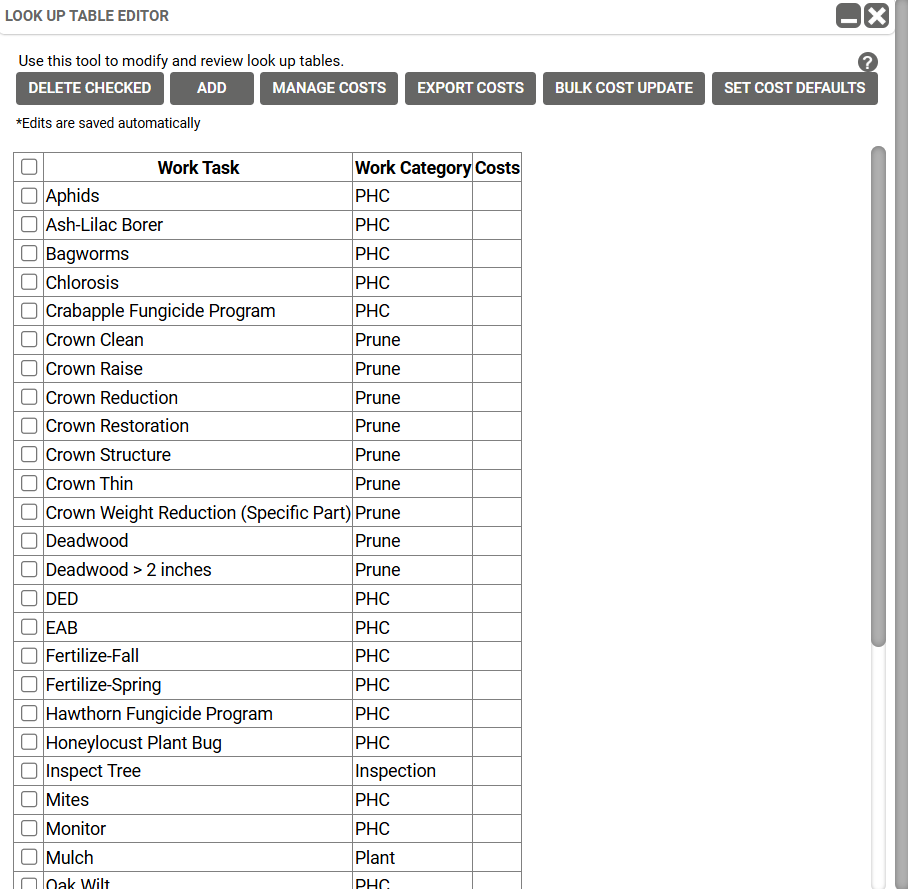
Work Tasks Lookup Table
The Work Tasks Lookup Table contains common work tasks. New work tasks can be added to the Lookup table by clicking the ‘Add’ button. Costs for work tasks can be added to the Costs column by selecting the checkbox near the Work Task name, and then editing the cost in the Costs popup window.
TreePlotter Support has a glossary of articles that detail the work management workflow. Some popular and pertinent articles to Projects are:
How To: Add Work Records
How To: Update Work Records
How To: Close Out Work Records
Known Limitations
- Must have Projects add-on module installed to use Projects.
- The current tree canopy cover per Project is the baseline for future canopy estimation and this has to be manually entered.
- TreePlotter Projects integrates components of our core products, TreePlotter INVENTORY and TreePlotter CANOPY. It is designed to work with both products but can be added to INVENTORY-only applications.
- Tracking the future estimated/projected tree canopy cover per Project:
- Overlapping tree crown circles will be double-counted. Keep this in mind when choosing the Mature Crown Radius.
- In addition, any canopy area that extends outside of the Project area boundary will be counted towards the Project’s goal even though it falls beyond its border.
- Trees that are removed from a Project are not currently factored into the future projected canopy estimate. This is an addition we will consider.
- A new Project cannot be created directly from the View/Plan/Grow tools in TreePlotter CANOPY. Users should click the Canopy button (top left) to turn these tools off and then can add a Project.
- The eco benefits of trees are calculated as annual values. We do not currently have the ability to estimate the cumulative lifetime benefit values of proposed or newly planted trees
Next Steps
TreePlotter CANOPY: Overview
How To: TreePlotter CANOPY – View Tool
How To: TreePlotter CANOPY – Plan Tool
How To: TreePlotter CANOPY – Grow Tool