
Did you know you can view your assets in a tabular format in addition to viewing your assets on a map? The DATA button in TreePlotter™ INVENTORY is the tool to use to list your data. As well as being able to view the data, you can edit and export from here too. It works in conjunction with the Advanced Filter enabling you to control which records are shown, and using the Views tool, you can control which fields you see. This is a way to create a report of the data in TreePlotter. This tutorial will walk you through everything you can do with the Data table.
Topics covered in this tutorial:
- Viewing data
- Viewing the trees on the map
- Editing data
- Displaying a subset of data
- Displaying a subset of fields
- Ideas for reports
- Exporting data
- Updating data
- Deleting data
Viewing data:
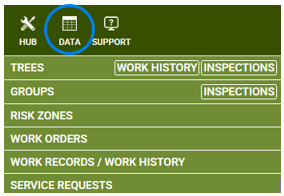
To access the Data table, click the ‘DATA’ button in the top left of the page. This will list all of your inventory layers.
The list of layers available will vary according to your subscription, but may also vary between roles depending on the permissions each role has.
Click each bar (e.g. Trees, Groups, Risk Zones, etc.) to expand it and display the data for that layer.
If the inventory layer can be inspected, there will be an Inspections button on the bar. Click the button to view the inspections. If the layer has Work History, there will be a Work History button as well.
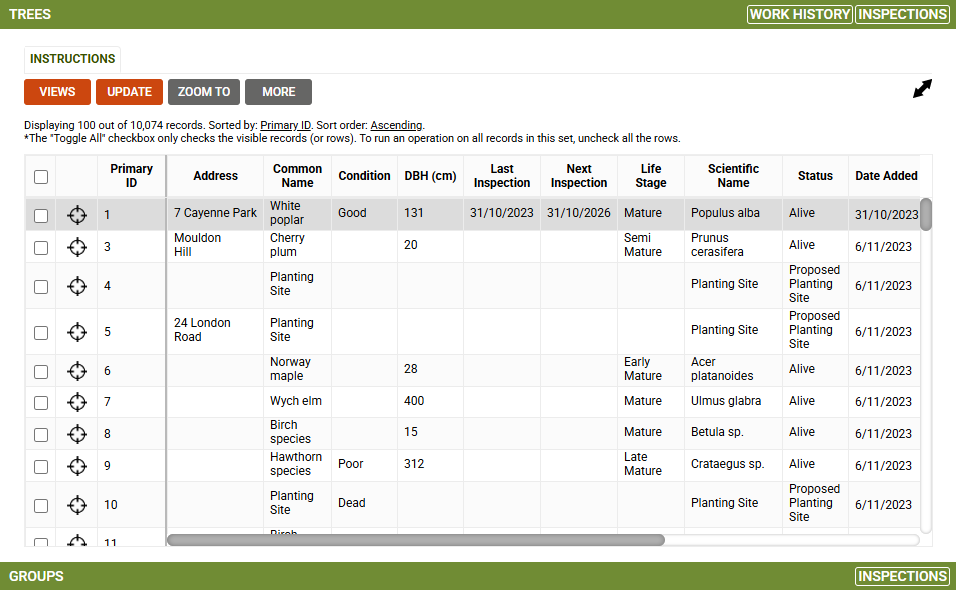
Use the scroll bars on the right side and at the bottom to view more of the table.
It is sorted by the Last Modified date, so the trees last edited will appear at the top. This is a quick way to get back to the tree you were last updating. You can change the order by clicking on one of the headings. In the example above, it’s sorted by Primary ID. Click on the heading a second time to sort it in the other direction.
Viewing the trees on the map:
If you are looking at the table and want to know which tree you are looking at, click on the cross hairs button to the right of the check box. It will zoom you into the exact tree you’ve selected.
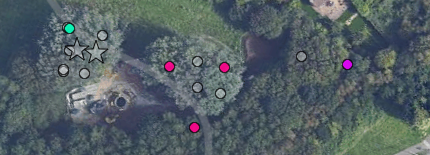
Alternatively, you can tick the box against several trees and then click the ZOOM TO button. This will zoom the map to such a level that all trees selected are displayed on the map.
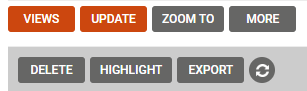
Another option is the Highlight tool. Click on MORE and tick the box next to any tree and click the HIGHLIGHT button. TreePlotter makes other trees a transparent grey while highlighting your tree(s) in colour. This feature can be handy when printing maps.
Editing data:
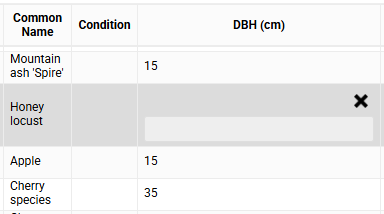
To edit features, click on the cell you wish to edit and make your changes. All updates in the Data Table are made in real time and save automatically. Making the changes whilst in this format can be a real time saver!
Display a subset of data:
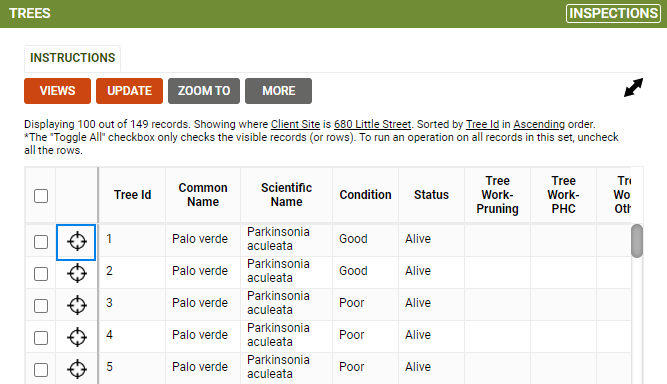
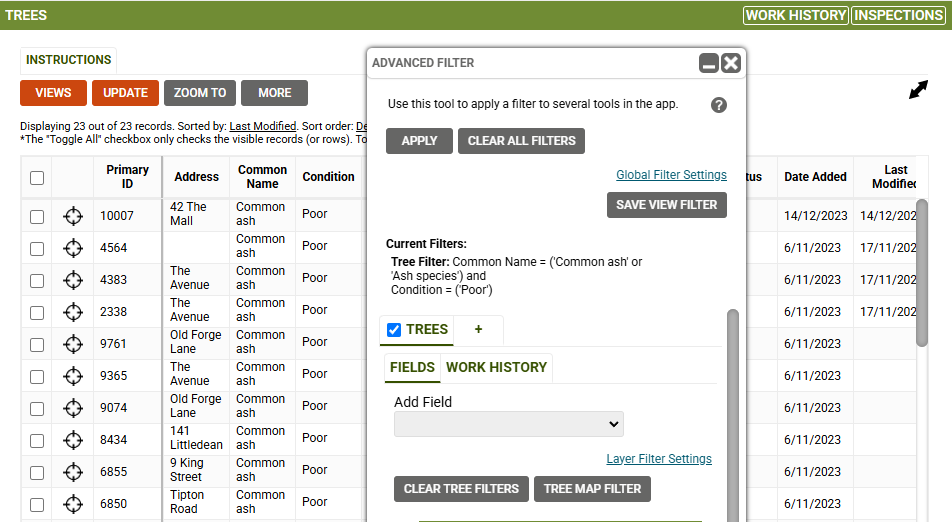
The Data table is dynamic and will reflect any filter applied. Click on the Advanced Filter button on the Navigation toolbar and filter for the section of data that you are interested in. Upon clicking Apply, the Data table will be updated accordingly. The map, Legend and Data table will all show the same records.
In this example, the trees have been filtered for Poor condition Ash trees. The number of records found is displayed at the top. In this case, the data table is showing 23 of the 23 trees filtered for.
Please see our tutorial on the Advanced Filter for more information and examples.
The Data table will show a maximum of 150 records at a time. If you have more to see, when you get to the end of the visible table, it will refresh to show you the next 50 (and hide the first 50).
Display a subset of fields:
You can control which fields are shown in the table. This is super useful when analysing the data so you ensure you can see what you want to focus on, and not be distracted by fields you don’t need to see. Once you’ve set up the perfect View, you can save it and then it will be there next time you need to view that information.
- Click on DATA > Trees > VIEWS
- In the ‘In Table’ column, tick the box against each of the fields you wish to include in the table. If you tick the topmost box under In Table, it will tick every field. If you subsequently untick it, it will clear all of the ticks from the fields, so you can just select the few you need
- In the ‘Frozen’ column, tick the box against the field you wish to appear fixed to the left of the table
- Click the ‘Sort’ button under Columns if you wish to control the order of the fields. Use the 3 dots to drag fields around. Click ‘Done Sorting’ when finished
- In the Sorting section, you can choose up to 4 fields to sort the data by, such as Primary ID, Common Name, or Tree Height. You can also choose whether it’s it’s ascending or descending order
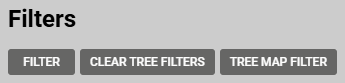
- Optional. If you already had a filter applied before coming into the Data table, it will be remembered if you save the view. This might be very handy if you will always need the same subset of data. If not, click on CLEAR TREE FILTERS to remove your filter. If you didn’t apply a filter but think that would be useful, click the FILTER or TREE MAP FILTER buttons as appropriate
- Optional. Click on SAVE VIEW to save this view for the future. Click ‘Create New View’ and enter a name when prompted
- Important. Click APPLY to apply these changes to the table
You can have as many of these as you like! They are saved per user, so if another user wants the same view as you, they’ll need to create one in the same way.
To delete a view, click on My Views > MANAGE and then click the cross against the existing view to be removed.
To access your saved views next time, click on VIEWS > My Views and choose it from the dropdown list.
Note: Please contact TreePlotter Support here to request fields be added or removed from the default view, bearing in mind any changes will affect all users each time they go into the Data Table.
Ideas for reports:
Important tree attributes – have a list of the key features of trees that you are tracking so you can see these values at a glance for any set of data you’re viewing
Specific topic – such as all of the TRAQ fields, or the fields used with CAVAT, or the appraisal fields
Visual Tree Assessment – all the fields needed to share the key attributes of a tree with colleagues
Exporting data:
Click on the MORE button and then EXPORT.
- Select the Export Type – your choice of CSV or shapefile
- Select the Layer
- Enter a file name if liked
- Click EXPORT
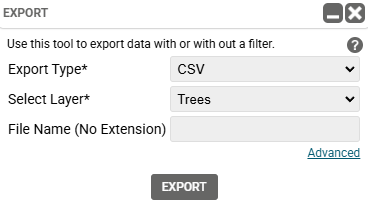
Note: This will export only the columns shown and for only the selected records. Against each record is a check box, if any are ticked, only those records will be exported. If none are ticked, all will be exported.
Updating data:
Mass updating trees can be done directly from the Data Table. While only Admins have access to this tool, it’s an easy way to make mass changes with a few clicks.
Note: Before proceeding with the steps listed below, ensure you have filtered for the records to be updated using the Advanced Filter. If no filter is applied, the update will make changes to ALL of your trees.
- Click on Data > Trees > Update
- Click on Add Fields and select the field(s) you wish to update
- Add/select your new values
- Click the ‘UPDATE’ button to apply this change to all of the trees selected
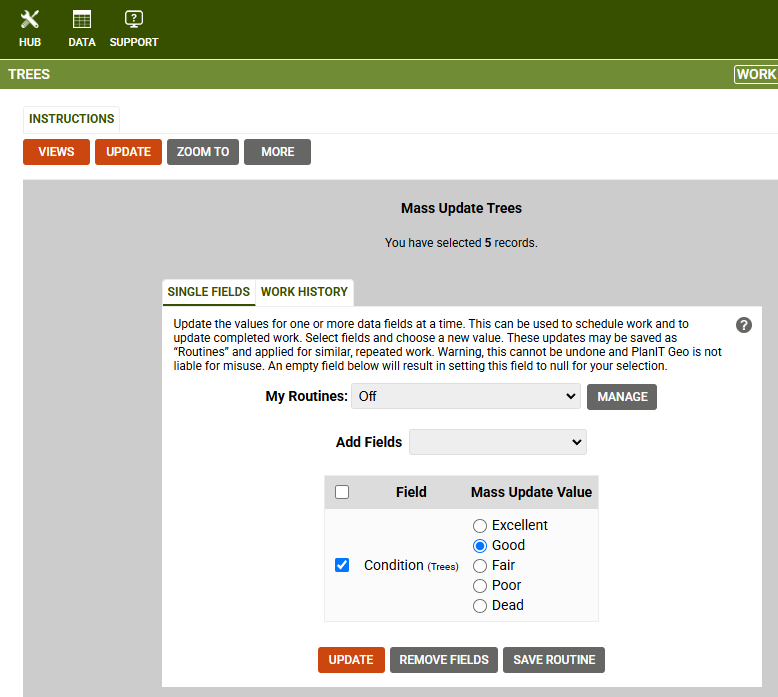
Warning: mass updates cannot be undone. Always double check your work prior to applying any changes. Please reach out to support@planitgeo.com if you encounter any mishaps.
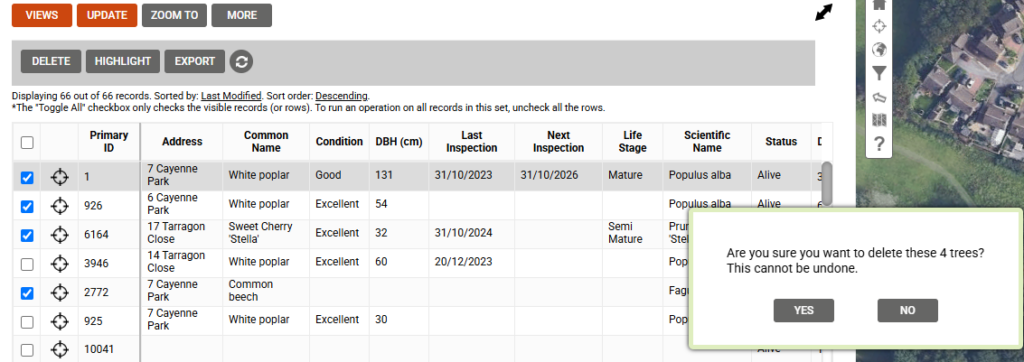
Deleting data:
Records can be deleted directly from the Data Table.
Note: Before proceeding with the steps listed below, ensure you have filtered for the records to be updated using the Advanced Filter or ticked the required boxes to avoid deleting ALL trees.
Click YES
Select the data with a filter. Alternatively, you can tick the box against the record(s) you wish to remove
Click MORE and then the DELETE button
Check that the number of trees it’s going to delete is the number you expected
Known limitations:
- The Data Table can only display up to 150 records at a time.