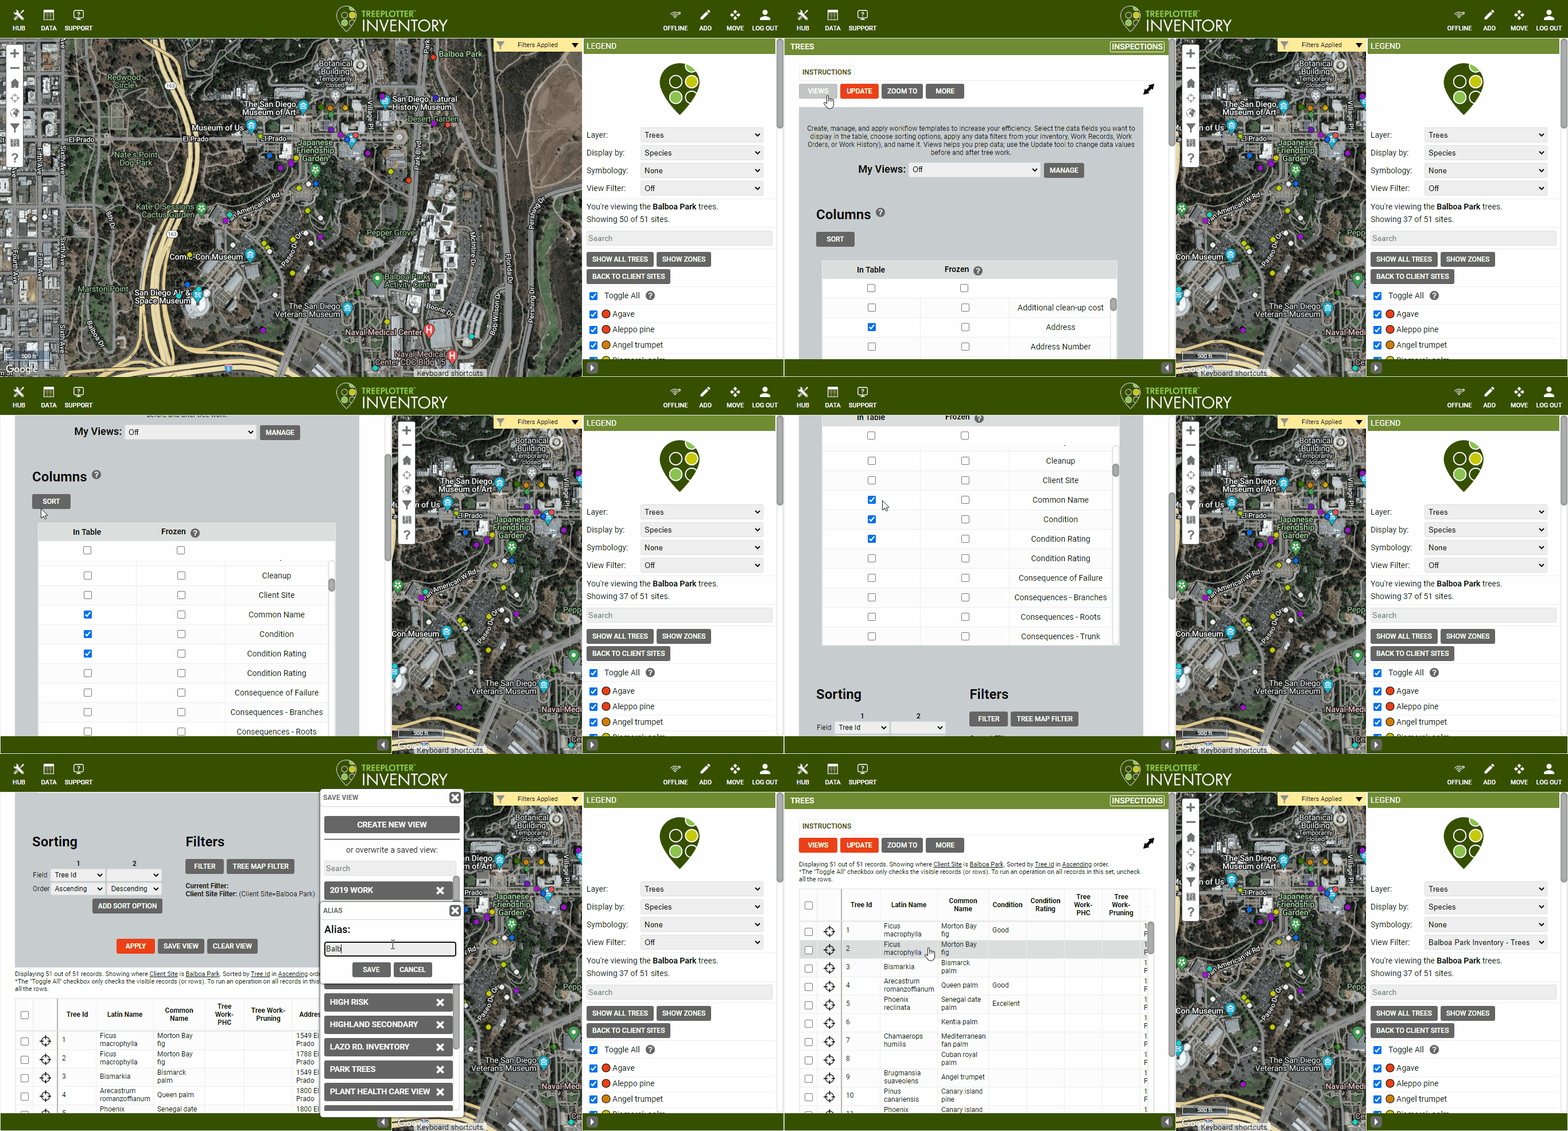
Views allow you to select the data fields you want to display in the Data Table as well as sort your columns based on your project needs.
Prerequisites:
- Tutorial: Data Table
Steps to create a new view:
- Click on Data > Trees > Views
- Check the fields you want to include in your view
Note: frozen columns stay fixed to the left side of the data table for easy reference. - Sort your fields (columns) so they are in the order you need them to be
Note: this order will carry through if you export out your data as a CSV or shapefile - Scroll down and click the ‘APPLY’ button if you wish to apply this view as a one time use. If you will use this table View on multiple occasions, create a shortcut for yourself by clicking the ‘SAVE VIEW’ button.
Note: if you don’t save your view, the format of your Data Table will be lost after you refresh your browser or log out. - To access and apply your Saved View to the Data Table, simply click on Views > My Views

Steps to apply or manage a saved View:
- Click on Data > Trees > Views > My Views
- From the dropdown menu, select the View you wish to apply to the Data Table
- To delete a view click on the ‘MANAGE’ button then on the ‘X’ located next to the View you wish to eliminate
Known limitations:
- Views are exclusive to the individual who creates them. This means that if you create a handful of views, no one else in your organization will be able to see them. With that said, it is possible for us to share Views with other members of your organization on the backend. For that, please email us at support@planitgeo.com or if you have any further questions.
