
The TreePlotter™ Tree Management Insights provide urban foresters and planners with a high-level overview of vital information reflecting the composition and diversity of an urban forest. These metrics help make qualified, data-driven decisions to inform future planning, planting, and maintenance strategies.
Topics Covered in this Tutorial:
- How to access Tree Management Insights in TreePlotter
- Using the Filter and Tree Management Insights
- Quick Stats on your Urban Forest
- Tree Diversity
- Tree Size Distribution
- Correcting Your Data
- Technical Guide and More Information
- Reports
How to Access Tree Management Insights in TreePlotter:
- Log In to TreePlotter
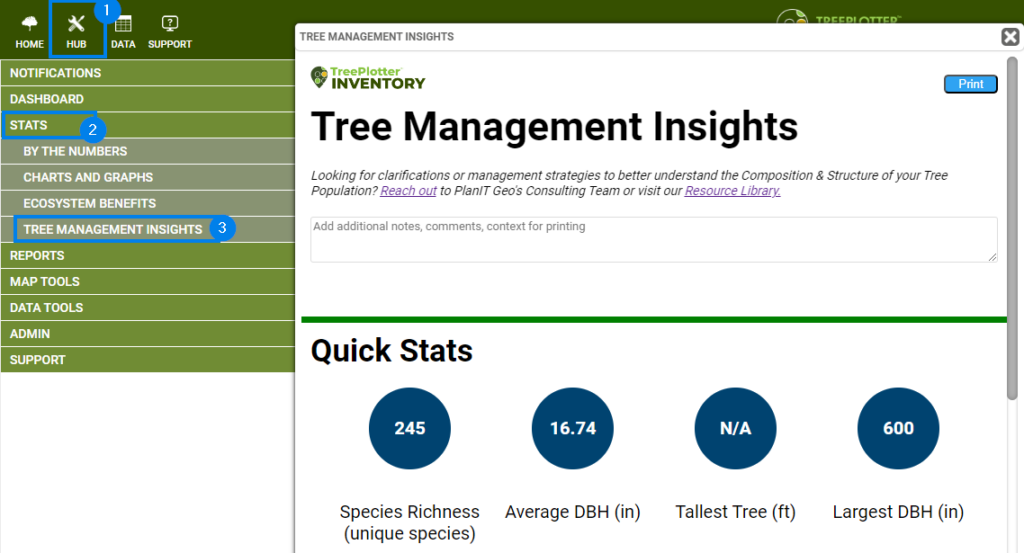
- Visit the Hub>Stats>Tree Management Insights
Using the Advanced Filter with Tree Management Insights:
Like many tools in TreePlotter, Tree Management Insights are reactive to the Advanced Filter.
Before you visit the Tree Management Insights tool, open the Advanced Filter (funnel icon) in TreePlotter to apply a filter. You can use the Tree Map Filter tool to draw a polygon around a selected area to only see the Tree Management Insights for that specific area, or apply a filter to the Status field to omit any open Planting Sites or Stumps. The Tree Management Insights tool will automatically omit any Archived trees in your inventory.
Next, visit the Tree Management Insights tool in the Hub>Stats to see the analysis for that area or subset of trees.
Quick Stats Explained:
Quick Stats in the Tree Management Insights helps with speedy analysis of your Urban Forest. Items include Species Richness, Average DBH, Tallest Tree, and Largest DBH Tree.
Species Richness:
The Species Richness counts the unique number of Species in your inventory. The Species Richness will be affected by the Common Name column in your Species List that have trees assigned to those values.
Average DBH:
The Average DBH is calculated by adding together the DBH measurements across your inventory entered in the DBH field within TreePlotter, then dividing the total by the number of trees included.
Tallest Tree:
The Tallest Tree is calculated by identifying the maximum Tree Height (estimated) across the Trees in your inventory.
Largest DBH:
The Largest DBH is calculated by identifying the maximum DBH found across the Trees in your inventory.
Tree Diversity:
The Tree Species Diversity charts show the top five most common tree species, genera, and families within the inventory or subset of your inventory based on data or map filters. The red horizontal lines demonstrate the 10-20-30 rule, which suggests an urban tree population should include no more than 10% of any one species, 20% of any one genus, or 30% of any family.
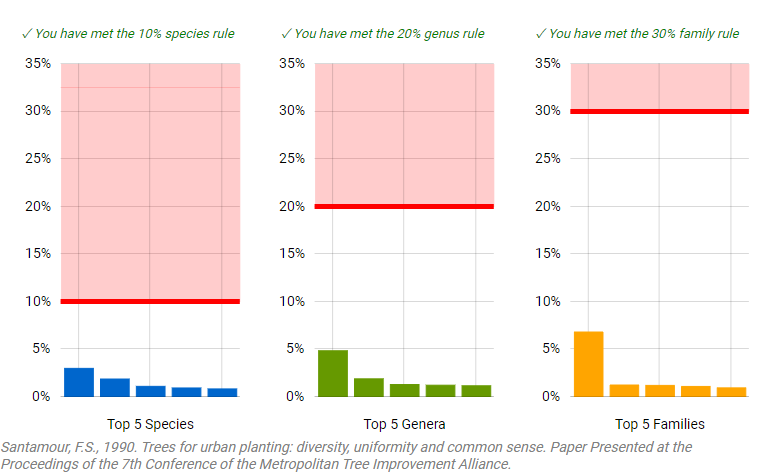
Tree Species Diversity Charts
The Tree Diversity is determined based on the Species, Genus, and Family columns in the Species table and the percentage of trees assigned to each Species, Genus, and Family. If you hover over the graphs, you can see the names of the Species that are identified within the diversity charts and the exact percentage.
If the names of the Species, Genus, or Family are not what you expected, we recommend checking your tree data and species list. To edit the Species table, visit the Hub>Data Tools>Look Up Table Editor>Species. You can see more about updating the Species list here.
You might notice that the numbers between the Genus, Family and Species charts (Hub>Stats>Charts and Graphs) are different than the percentages listed in the tool. This is because the Tree Management Insights determines the percentage of the Species, Genus, or Family based off the percentage of your entire inventory. On the contrary, the Genus, Family, or Species chart (Hub>Stats>Charts and Graphs) shows the percentage based on the Top 10 in your inventory.
Tree Size Distribution:
This chart displays the most recently recorded diameter (diameter at breast height or DBH, measured 4.5-feet above natural grade) values along with DBH goals (as defined by Richards et al. in 1983 and 1993). This information is often used to identify a tree population’s structure, distribution of tree canopy cover and associated benefits, current maintenance needs, projecting potential surges in maintenance and removal needs, among other considerations in sustainably managing trees in communities. A distribution of tree size classes as indicated by the “Goal” uniformly distributes tree benefits and maintenance needs. Smaller, younger trees compared to large diameter trees aim to compensate for the loss of tree canopy cover and associated benefits that occur when large trees reach their full potential, mature, and begin to decline, requiring eventual removal (in most cases).
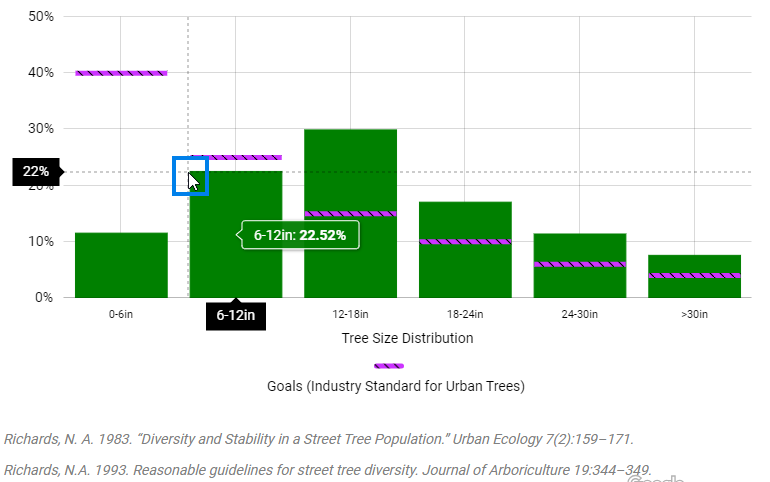
Hovering over the graph will show the exact percentage of the Trees within that range. The purple line indicates the goal for Urban Forests Tree Size Diversity.
The Tree Size Distribution for each bar in the graph is controlled by the DBH across all of the trees in your inventory. If your graph is missing data, more trees will have to have their DBH measured and entered within TreePlotter.
Correcting your Data:
If the data in your Tree Management Insights is not what you expect it to be, use the following steps to correct your data.
- Species: Set a filter for the common name in the Advanced Filter, and investigate the data within the Trees layer to see what might be classified incorrectly. Go to the Species List (Hub>Data Tools>Look Up Table Editor>Species) to fill in any missing values into the Common Name column.
- Genus: Go to the Species List (Hub>Data Tools>Look Up Table Editor>Species), and fill in the Genus to have it appear correctly in the Tree Diversity graphs.
- Family: Go to the Species List (Hub>Data Tools>Look Up Table Editor>Species), and fill in the Family Name to have it appear correctly in the Tree Diversity graphs.
- DBH (Average and Largest): Go to the Advanced Filter to see the range of the DBH values, filter for the Maxiumum number to see the Trees classified as having the largest DBH. Correct any Trees on the map with accurate DBH numbers.
- Height (Tallest): Go to the Advanced Filter to see the range of the Tree Height values, filter for the Maxiumum number to see the Trees classified as having the largest Height. Correct any Trees on the map with accurate Height numbers. If you are not seeing the Tree Height within the filter, the Height might not be turned on within your application. Reach out the support@planitgeo.com for assistance.
- Tree Size Distribution: This graph uses the DBH Range fields that are auto calculated from the DBH automatically in the Tree Details form. First, make sure the DBH Range is turned on in the Tree Details form by opening a tree and finding the field. If you cannot find the field, reach out to support@planitgeo.com for assistance. Next, open the Advanced Filter to filter for each value independently, that will show how many Trees are associated with each type. If you see any data that is not classified correctly, you can filter for the DBH number value and mass update the DBH Range to reflect the correct value. For assistance with this workflow, reach out to support@planitgeo.com.
Technical Guide and More Information:
For background information about the Tree Management Insights concepts used in the tool and how to use this tool to improve your Urban Forest.
Check out our Technical Guide: Tree Management Insights here.
Reports:
To print a report of the Tree Management Insights, click the ‘Print’ button in the top right corner. You can then print the report or save it as a PDF on your local device.
To add comments to your report – edit the text areas at the top of the tool, within the Tree Diversity, and within the Tree Size Distribution areas. This allows you to fill in personalized Urban Forest information and recommendations pertaining to your own Urban Forest.
Known Limitations:
- The Tree Management Insights tool does not omit Planting Sites, Stumps, or Removed trees by default. Those can be omitted from the tool using the Advanced Filter.
- Additionally, the Advanced filter is not “live” – You must close and reopen the Tree Management Insights tool if you update the filter while the popup window is open.
- The Tree Management Insights report cannot be edited by Professional Services to include more information or remove information. The data displayed in the tool is controlled by the data entered within the Trees layer in TreePlotter. Contact support@planitgeo.com if you need additional assistance.