
The Interactive Legend (or Filter Legend) appears as a side panel on the right side of the TreePlotter™ application. This tool enables users to display features based on selected fields, providing dynamic filtering capabilities for your tree data.
Topics covered in this tutorial:
- The Layer dropdown
- The Display By dropdown
- Symbology
- View Filter
- Number of Features
- Display By check boxes
- Charts
- Reference Layers
- Video Tutorial
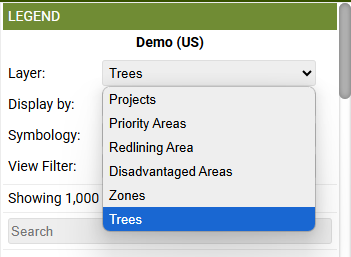
The Layer dropdown
Use the Layer dropdown to specify which layer to display on the map. The Display By populates with the fields from the layer selected in this dropdown.
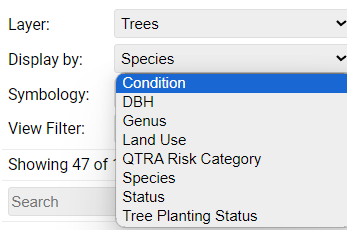
The Display By dropdown
Choose a field from the Display By dropdown to color-code your assets on the map. This creates a visual representation of your inventory based on the selected attributes.
The options in this dropdown can be customized to your needs. Additional fields can be added or removed, provided they are radio button or dropdown fields. To request changes to your Display By options, contact the Professional Services team at support@planitgeo.com.
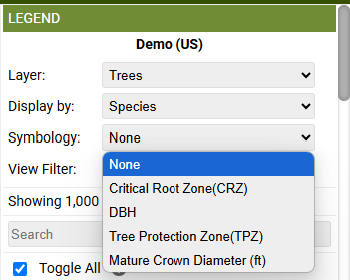
Symbology
Beyond color-coding, you can select a second attribute to modify how assets appear on the map. For instance, point size can vary based on DBH measurements. Alternatively, selecting TPZ or CRZ from the dropdown will display the Tree Protection Zone or Critical Root Zone as a ring around each feature.
View Filter
The View Filter dropdown allows you to access and select any saved filters you previously created using the Advanced Filter. This dropdown only appears after you’ve saved at least one View Filter under your account.
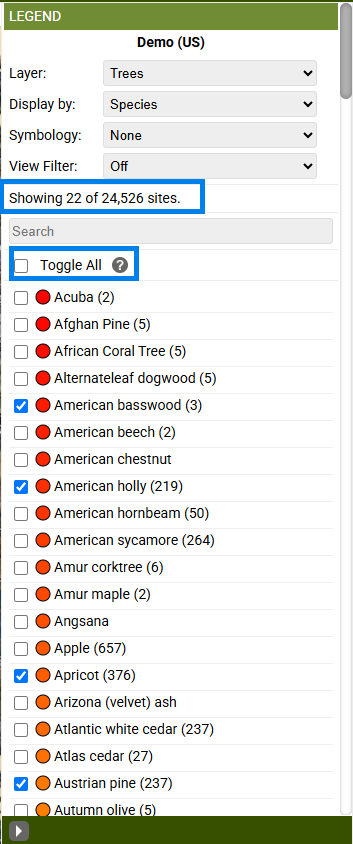
Display By Checkboxes
Below the dropdown fields, the legend shows:
- Number of features currently visible
- Total number of features
- Color-coded options based on your “Display By” field selection
Each option appears with its corresponding color and feature count. You can use the checkboxes next to each option to show or hide specific values. The “Toggle All” button allows you to hide all values at once, while selecting or deselecting individual items lets you display any combination of points on the map.
To maintain performance, the map limits feature display to 2,000 features on computers and 500 features on mobile devices. For layers exceeding these limits, the map displays a random selection and updates the feature count (ie. “Showing 2000 of 24526 sites”). The number of visible features also depends on your current zoom level, selected features, and map extent, as features outside your current view aren’t visible.
Note: Unchecking a box only visually removes the feature from the map, which is not the same as filtering out those records.
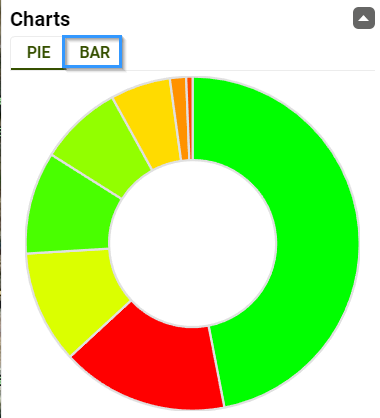
Charts
Charts show a graphical representation of your data based on the selection in the Layer and Display By dropdowns. Select to view either a Pie or Bar Chart.
Reference Layers
This area displays all Reference Layers uploaded to your app. Use the checkboxes to toggle them on or off. You can activate multiple Reference Layers simultaneously, and they will display on top of the active Layer. Learn more about uploading Reference Layers in this tutorial!
Known Limitations:
If you can’t see the Legend, it may have been minimized. Look for a Legend box in the bottom right and click on it to expand the Legend.
Next Steps:
Tutorial: Reference Layer Importer
Video Tutorial: