The “Grow” tool empowers users to set and track tree canopy goals, assess various planting and canopy cover scenarios, and project future ecosystem benefits. By adjusting key factors such as the amount of new tree canopy, the average size of planted trees, and anticipated changes in ecosystem services (based on i-Tree data), the Grow tool provides a comprehensive simulation of how tree planting initiatives can impact both local canopy coverage and environmental outcomes. Users can generate detailed reports that summarize projected canopy growth citywide, highlight the effects across specific regions, and provide visual maps to enhance decision-making.
The tool relies on three key inputs: the target canopy percentage (or desired increase), the average crown diameter of trees at full maturity, and the mortality rate. These factors help determine how many trees are needed to meet objectives, calculate the potential canopy expansion across the area, and estimate the resulting shifts in ecosystem services.
Additionally, the Grow tool supports staged implementation. For example, a user might initially aim for a 10% canopy increase in one or more areas using trees with a 20-foot crown diameter, then later add another 5% canopy with trees of a 30-foot diameter in other locations. This flexible, phased approach enables strategic, site-specific planning tailored to diverse landscape needs and project goals.
Instructions:
Step 1 – Select a Geography:
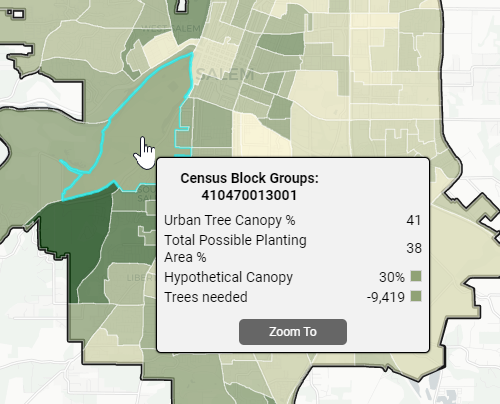
Select the geographic boundary of interest by using the drop-down menu. The selected geography will be displayed on the map.
Step 2 – Set Grow Method and Quantity:
Using the slider boxes, select whether to set the canopy using a target canopy percentage or to increase the canopy by a specific percentage. Selecting Target Canopy % will add or remove tree canopy from selected areas to reach a target goal. Selecting Increase Canopy By % will add a fixed percentage to the existing canopy level of selected areas.
After the grow method is selected, slide the average tree crown diameter toggle to set the tree size. The model is calibrated to estimate 20, 25, 30, 35, or 40-foot tree crown diameters. This diameter is the modeled new trees at full maturity, not the planting size.
Step 3 – Set Average Tree Crown Diameter:
Use the toggle to set the mortality rate of newly planted trees in the model. The model is calibrated for a range between 0% and 20%.
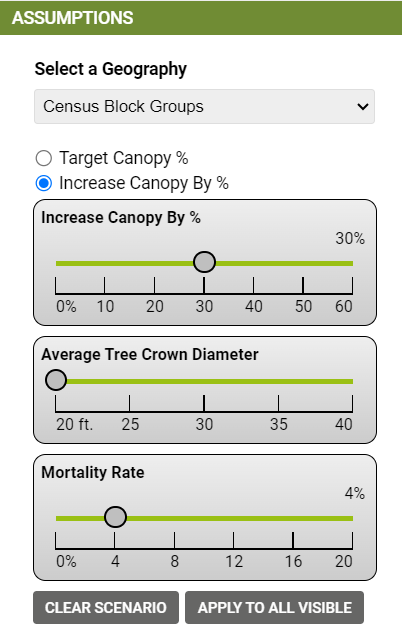
Step 4 – Activate the Tool and Select Areas: Activate the Grow tool by selecting the bottom “Apply to All Visible”. Next, add areas to the planting scenario by hovering the cursor over any area in the map and pressing the “G” (Grow) key on the keyboard. Hypothetical canopy percentages and trees needed values are added to the selected areas popups. To remove selected areas from the scenario, press the “R” (Remove) key on the keyboard while hovering the cursor over them.
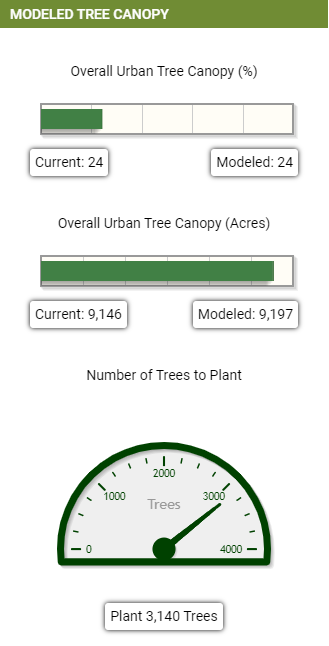
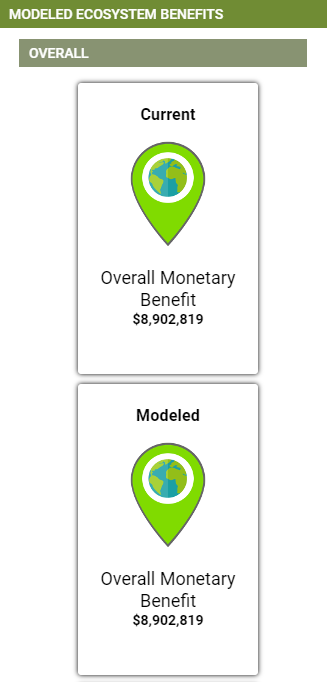
Step 5 – Review Modeled Tree Canopy: After the grow scenario is complete, scroll down to the Modeled Tree Canopy section to see the scenario’s effect on the overall tree canopy. Below that, a user can view Modeled Ecosystem Benefits. To view a table of the scenario details, select the Detailed Grow Report. Each scenario can be saved and printed.
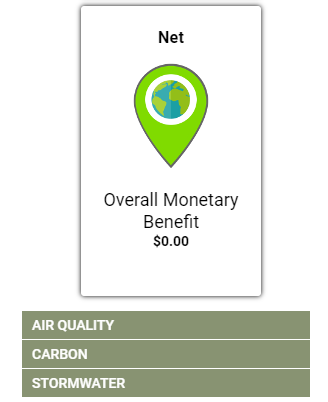
Step 6 – View Modeled Ecosystem Benefits: TreePlotter CANOPY calculates the monetary value of ecosystem benefits provided by the newly planted trees.
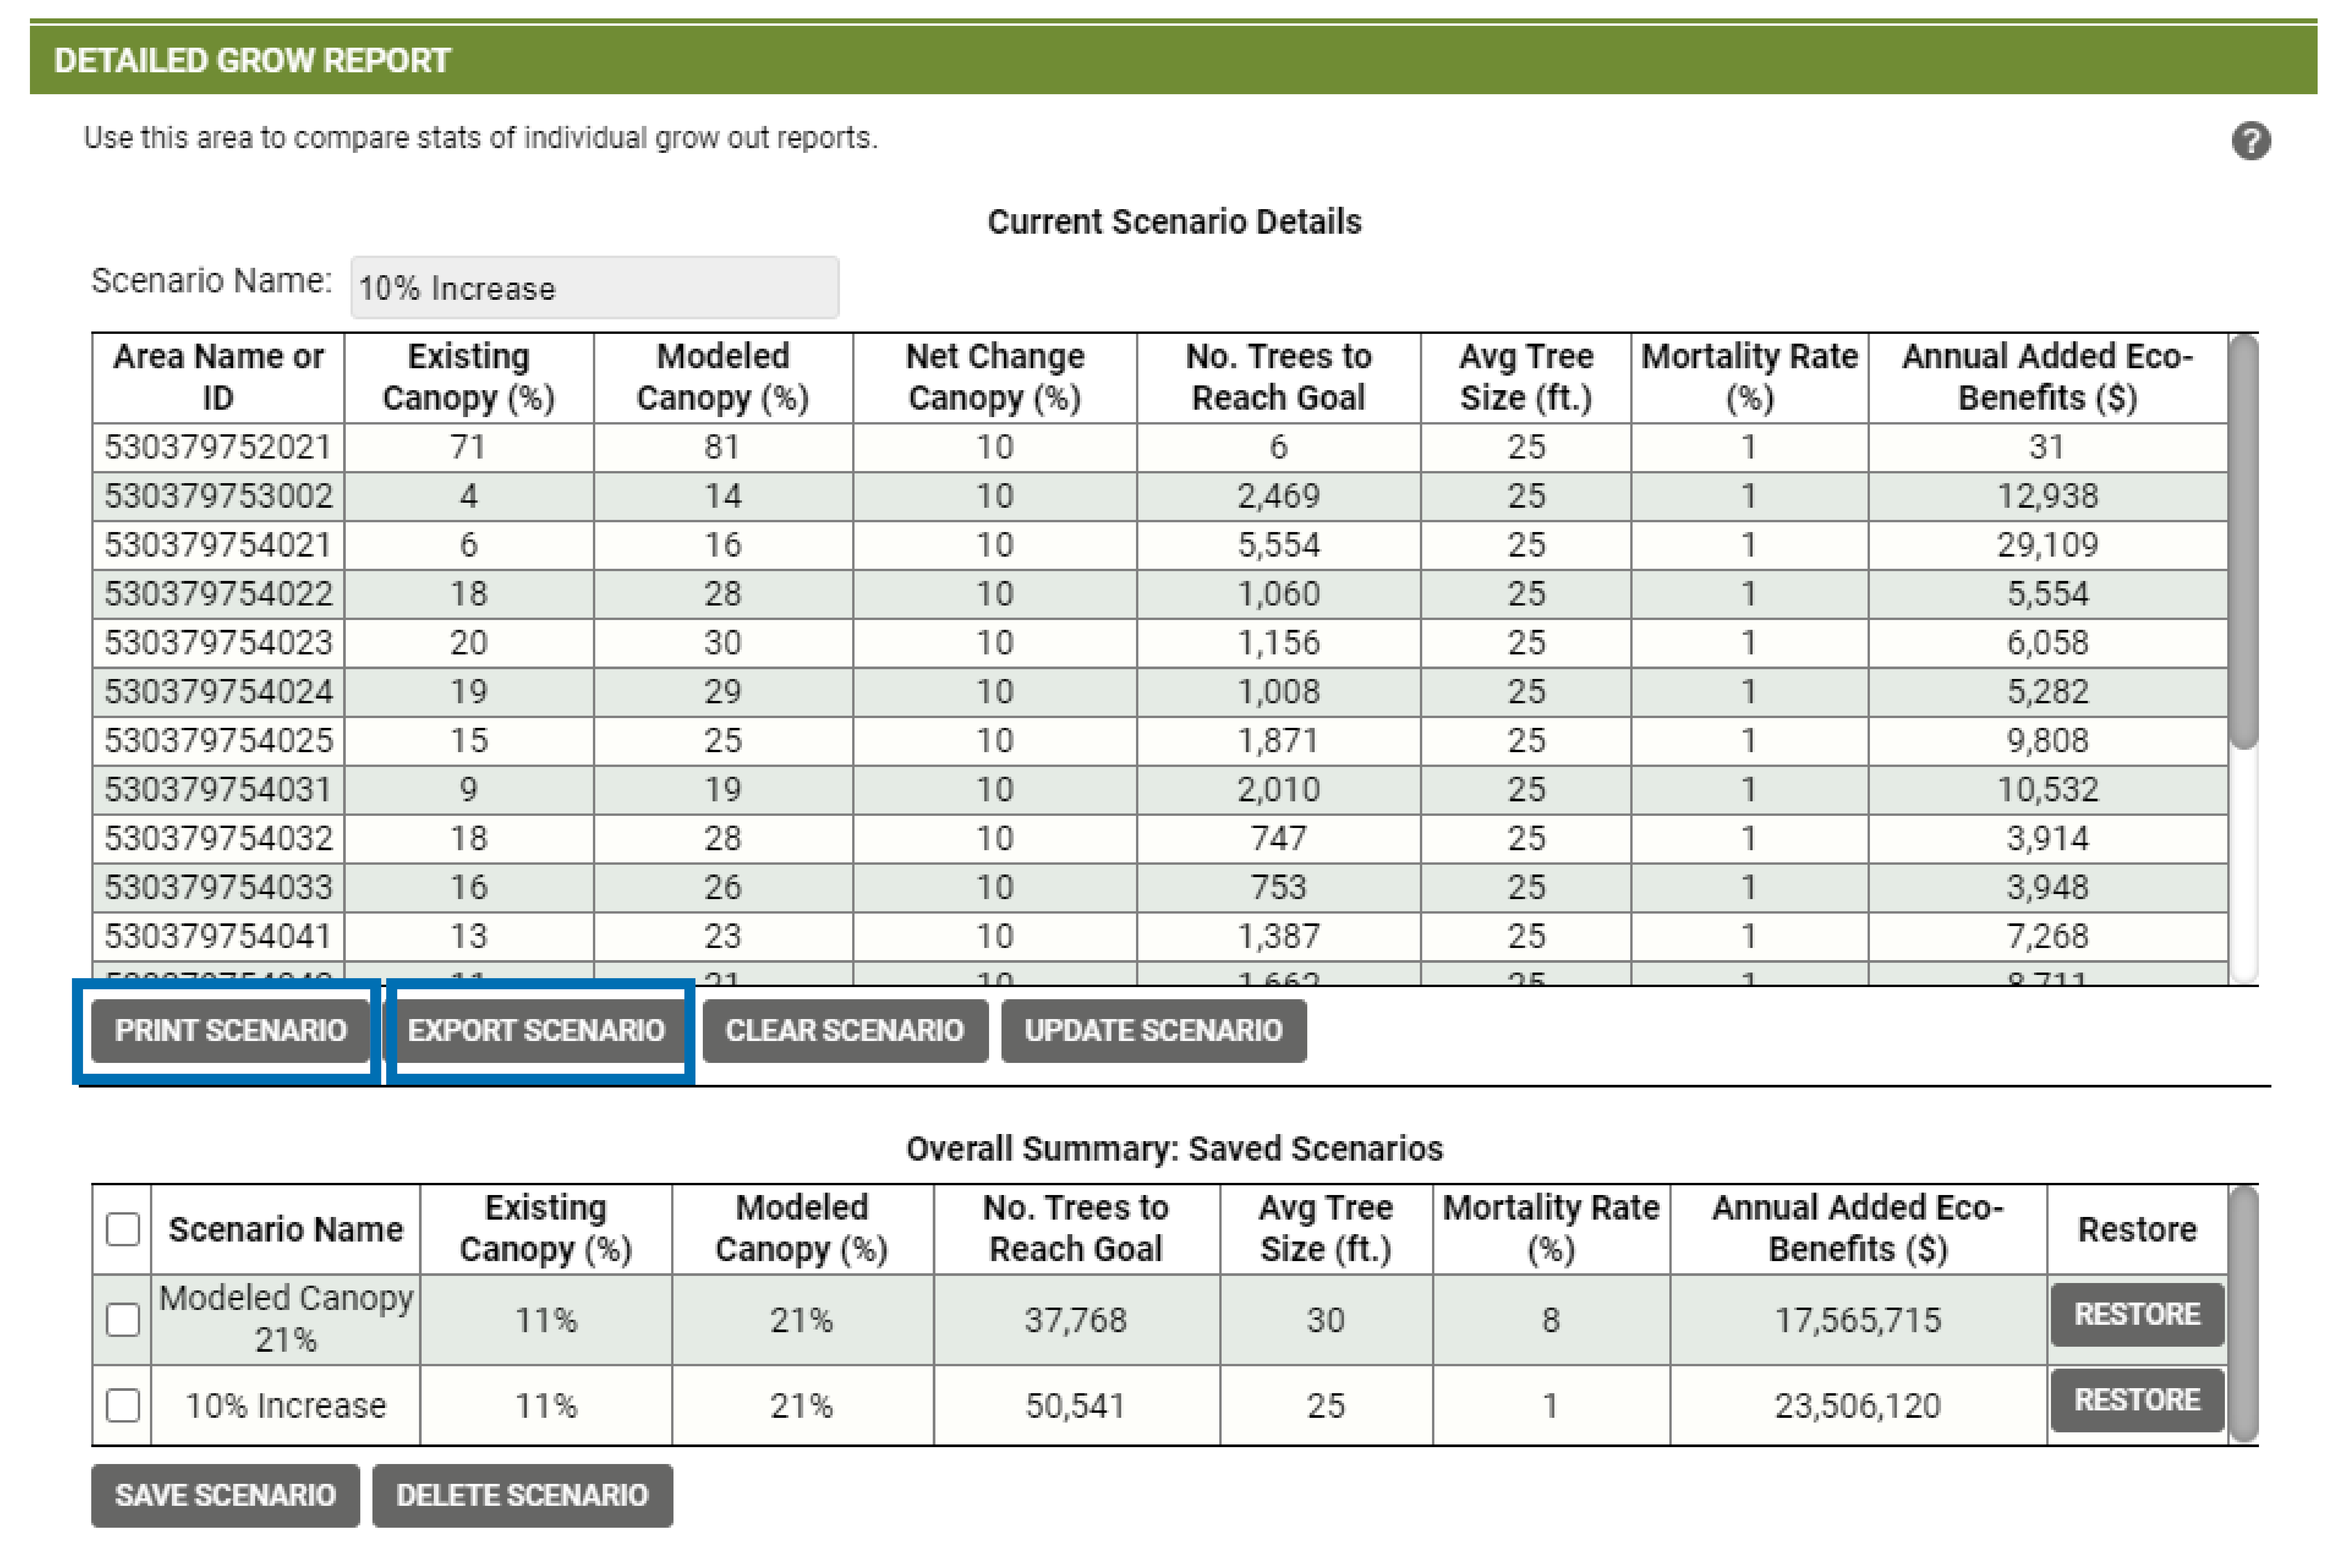
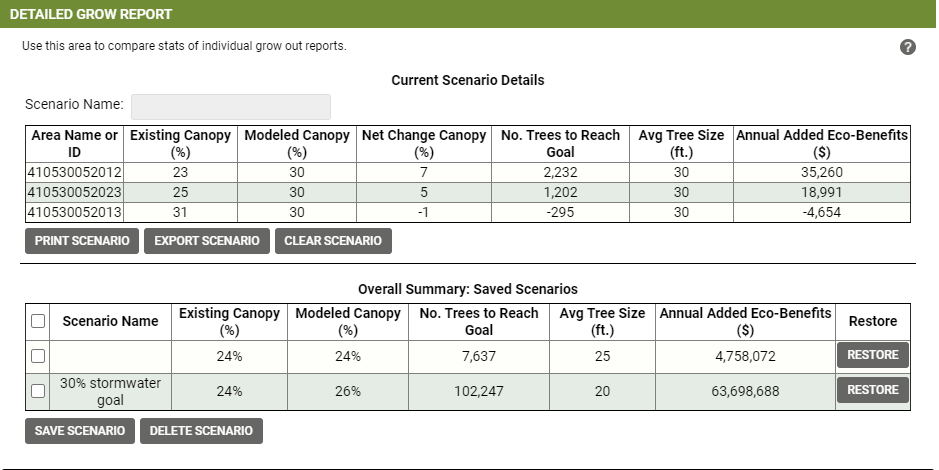
Step 7 – View Detailed Grow Report: To view a table of the scenario details, select the Detailed Grow Report. Each scenario can be saved and printed.
Understanding the Assumptions:
Target Canopy %
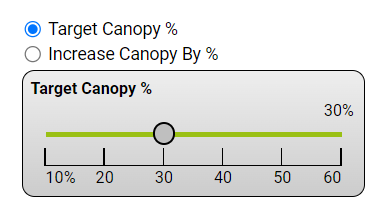
If wanting to gather data based on the Target Canopy %, you will enter the goal for your area or for the polygons you have selected. By default, a target canopy of 30% will be applied. Depending on the ecological makeup of the geographic area, you may set a higher or lower target canopy.
Increase Canopy By %
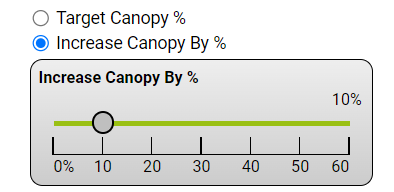
If wanting to see how many trees you will need to plant based on the percentage you wish to Increase Canopy by, you will enter the goal for your area or for the polygons you have selected.
By default, an Increase Canopy By 10% will be applied. Depending on the ecological makeup of the geographic area, you may set a higher or smaller percentage to Increase Canopy By.
Average Tree Crown Diameter
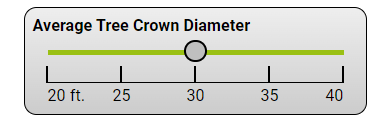
Average Tree Crown Diameter is the average crown diameter of the trees you will be planting at full maturity. The crown diameter will affect how many trees can be planted in a given acreage.
If you are planting one species or many species, averaging the adult crown diameter will provide a more precise estimate of how many trees will need to be planted to reach the Target Canopy %.
Mortality Rate
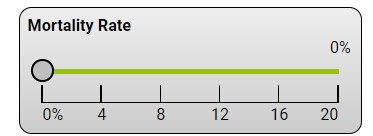
Using this Mortality Rate feature, you can indicate the mortality rate of the trees in your area. TreePlotter will then account for that variable when calculating the number of trees that will need to be planted to reach your Target Canopy % goal.
Mortality Rate can vary depending on species, climate, pests, and condition of the trees. The Mortality Rate will default to 0%.
Understanding Modeled Tree Canopy:
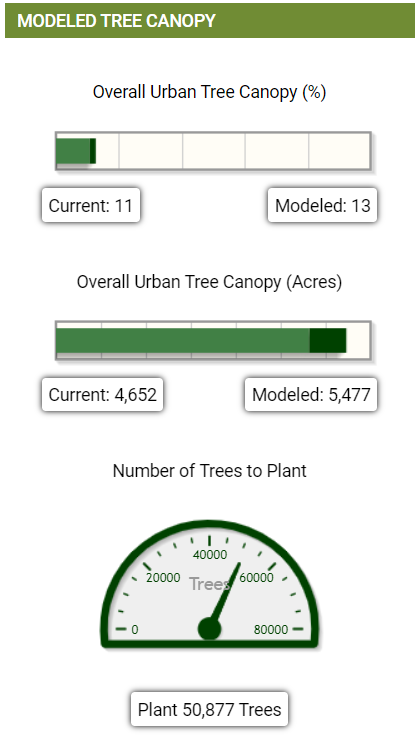
Using the Modeled Tree Canopy section, you can view the current and modeled Urban Tree Canopy % and the Overall Urban Tree Canopy in acres.
The current numbers will outline the Overall Urban Tree Canopy % and the Overall Urban Tree Canopy in acres for your area for the present time.
The modeled numbers will represent the Overall Urban Tree Canopy percent and acres if the desired percentage of Urban Tree Canopy is achieved.
The modeled and current numbers are relative to the entire area in your application.
The dial for the number of trees to plant will be immediately available to determine how many trees will need to be planted to reach the canopy percentage goals.
These numbers are to be used as a guideline. Further field assessments will be needed to determine where to plant these trees and the suitability of those trees for a given area.
Saving a Scenario and Printing Your Reports:
In the Detailed Grow Reports section, the scenario you created will populate in the Current Scenario Details. You can print reports, export your data, and save scenarios.
To Save: First, give your scenario a name. Then, click on Save Scenario at the bottom of the section. When you come back to your application, you will see your scenario in the Overall Summary: Saved Scenario section. Click Restore next to the Scenario to view the scenario again.
To Print: Before or after saving, you can Print your scenario by clicking the Print Scenario Button. This button will print out a detailed report to share with colleagues and stakeholders. You can also export your scenario by clicking Export Scenario. This button will export out the data into a CSV format. From there, you can make charts, graphs, and other visualizations using Excel.