
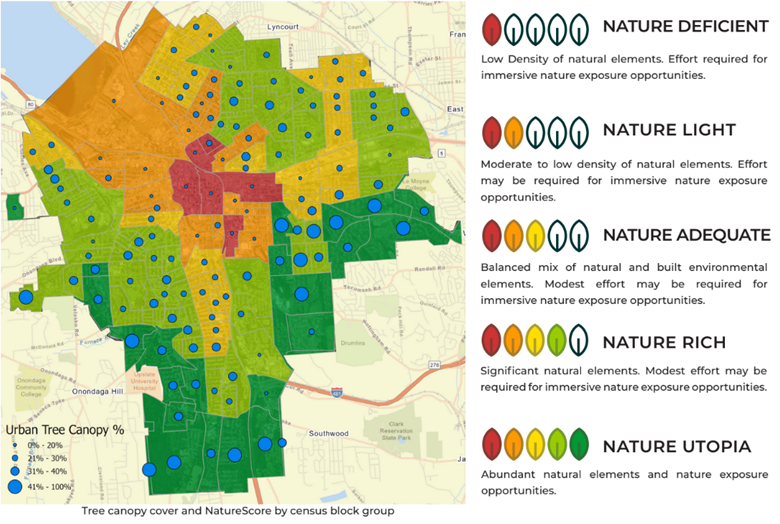
NatureQuant analyzes and blends various national data sets including satellite infrared measurements, GIS and land classifications, park data and features, tree canopies, human modifications, air, noise, and light pollutions, and computer vision elements to create a NatureScore, or the highest correlation with the predictive health impacts of given natural elements via a machine learning process. This is integrated in TreePlotter by combining the quantity and quality of natural elements with the canopy cover within census tracts.
Visualizing the Data
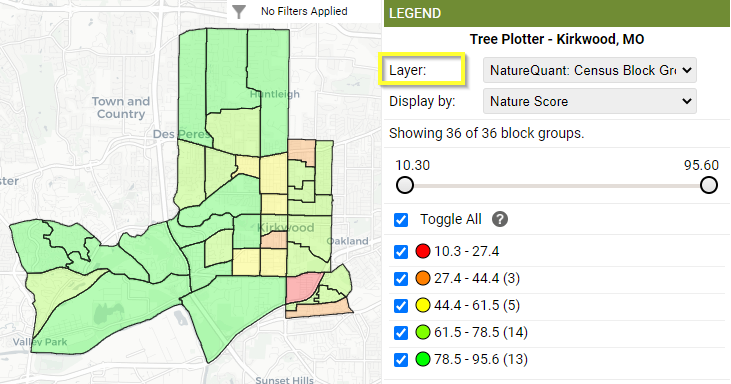
To view your NatureQuant data on the map navigate to the ‘Layer’ dropdown within the Interactive Legend.
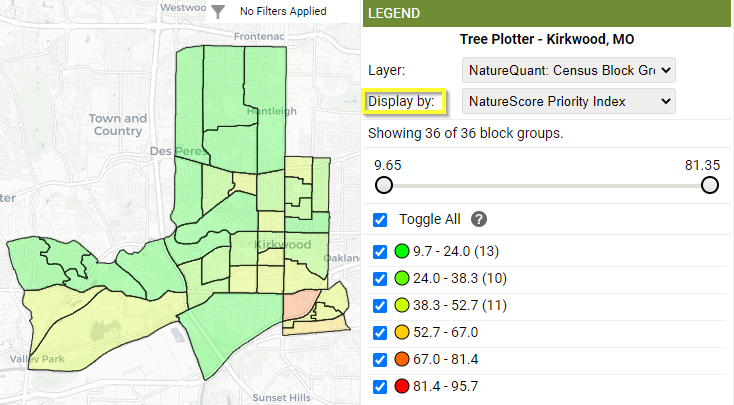
From here you can toggle between available fields with the ‘Display by’ drop down menu feature.

Compare Block Group data with your Tree Inventory by selecting either the Nature Score or Nature Priority Index within the Trees layer Display by.
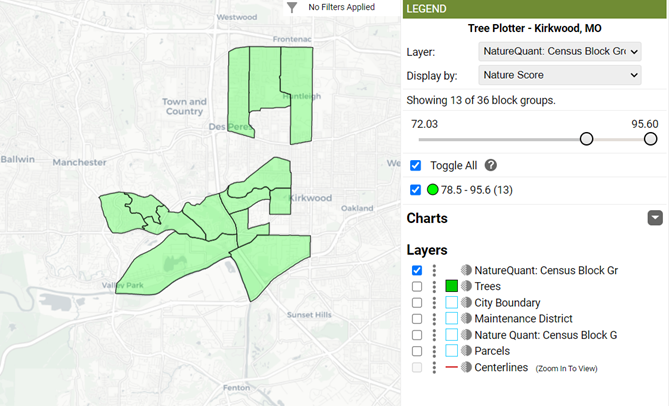
To view specific value groups you can use the slide bar or check boxes to toggle between different Nature Score or Nature Priority Index ranges.
Compile the Data
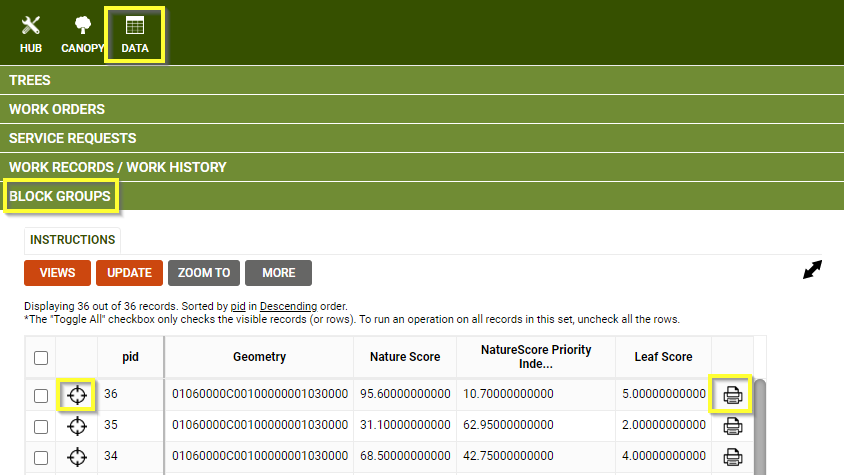
View your data in tabular form within the Data Table. From here you can zoom to any area by clicking on the corresponding crosshair on the left hand side of the panel or you can access a single block group report by selecting the ‘Printer’ icon on the right hand side of the page.
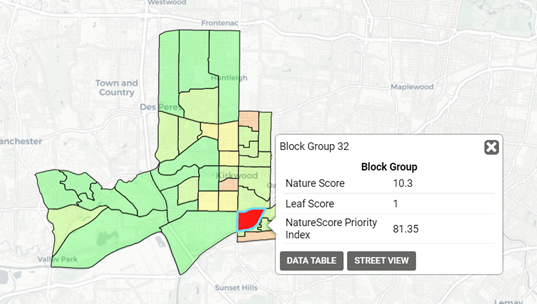
A second way to view your data values is by selecting a block on the map to view an area’s details. From here you can view the data in the Data Table or open up a ‘Street View’ to see the area in question on the map.
Reports – Charts – Graphs
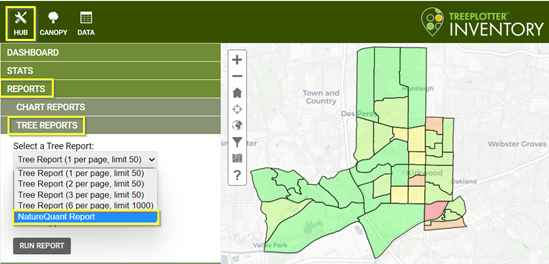
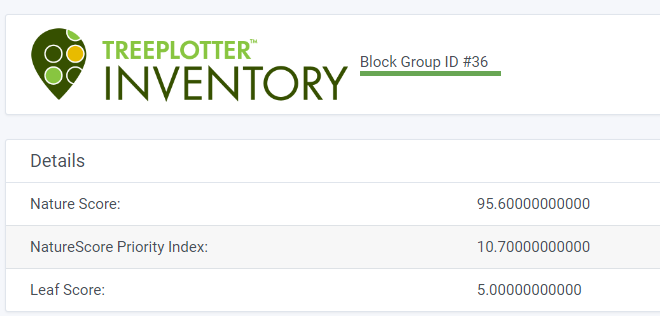
Aside from viewing data on the map or in the data table you can create comprehensive NatureQuant reports throughout the HUB > Reports > Tree Reports dropdown
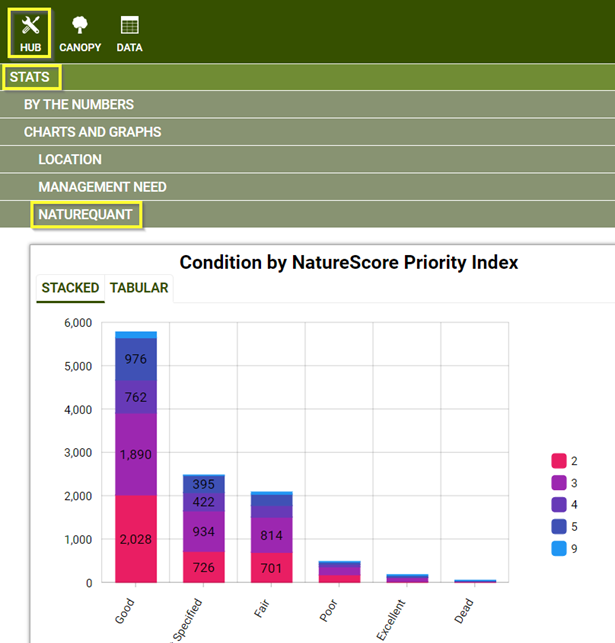
Additionally, you can easily generate Charts and Graphs on a range of features including: Condition by NatureScore Priority Index, Trees by NatureScore Priority Index, Trees by Nature