
This add-on module for TreePlotter™ INVENTORY allows you to carry out surveys in accordance with the BS5837 requirements. You can accurately map tree canopies, root protection areas, import/export CAD files and more. NOTE: This module is only available for UK based customers.
Create a new survey:
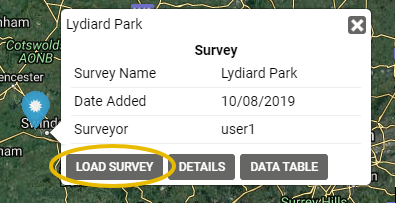
- Click on Add and click on the map to create a new survey
- The survey will appear in the Interactive Legend. Click the name and then click the Load Survey button
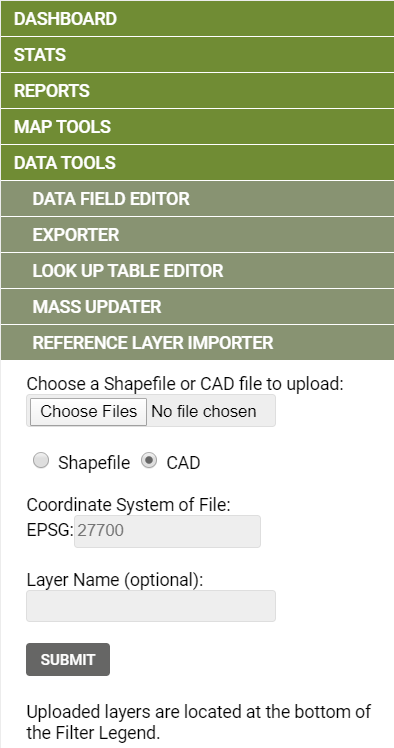
- Import CAD data, if required, by going to Hub -> Data Tools -> Reference Layer Importer and choosing a file
- You can give it a name using the Layer Name field
- Click Submit. It may take a moment depending on the size of the file
- Repeat for any other data you wish to upload
- Add the details to the survey by changing the layer drop-down to the layer you wish to add to, click on the Add button and click on the map to plot those features
- Each component will be given a unique reference number ie the first tree plotted will be T1, the second T2, the first woodland W1 etc
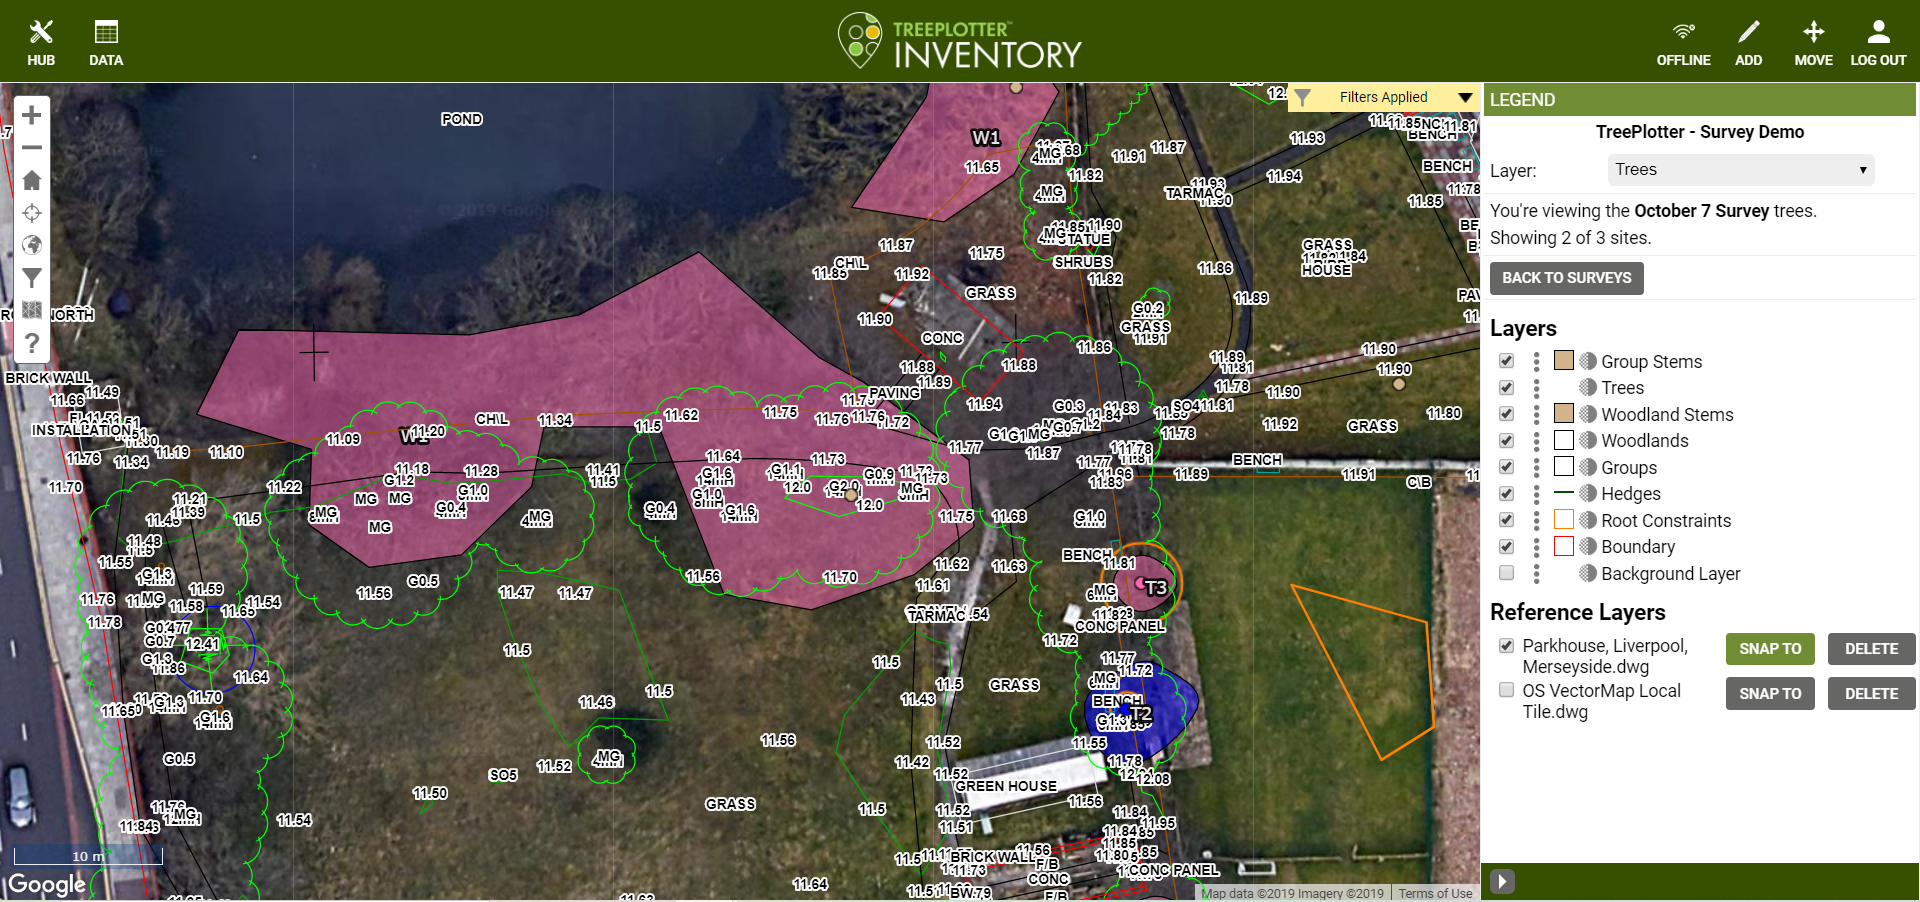
- Control which layers are visible with the tick boxes
Note: See the Reference Layer Importer notes for more information on that tool
More detail on each of the layers:
Boundary – the outline of the survey area.
Trees – plot trees and update the Tree Details with information about each tree.
Required/mandatory fields – if fields that have been set as mandatory are not populated, the Missing Required Fields tick box at the end will be ticked. Once the fields are populated, the tick will automatically be removed. The colour of components that have incomplete data will be pink but once they are complete, the colour will reflect the quality.
Tree Details -> Number of Stems – if the tree has 1 stem then specify the Number of Stems and the Stem Diameter. If the tree has between 2 and 5 stems then the Multi Stem DBH calculator will appear so you can enter the diameter of each stem and the Stem Diameter will be automatically calculated. If the tree has 6 or more stems, then the multi stem calculator will be replaced with a Mean Stem Calculator.
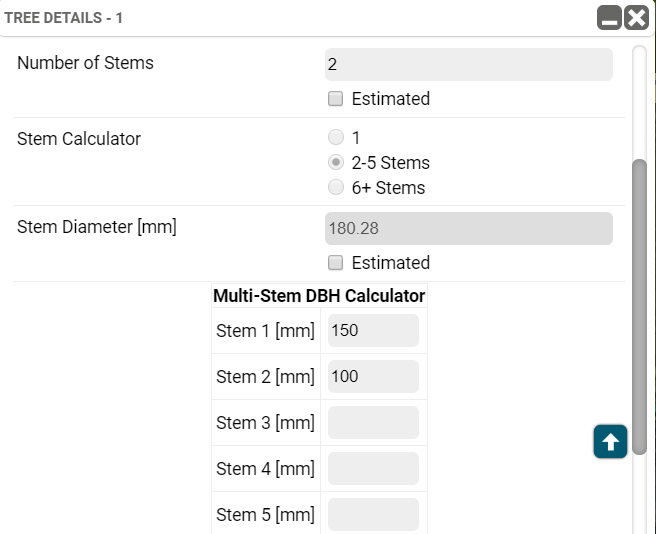
Note: If there is a mismatch between the Number of Stems and the Multi-Stem DBH Calculator, then the record will be marked as incomplete and coloured pink accordingly.
Tree Details -> Root Protection Area – this is shown as a pink circle around the tree. It is calculated based on the Stem Diameter on the Tree Details. If a tree has multiple stems then the Multi Stem Calculator appears.
If a tree has a Physiological Condition of ‘Veteran’, there will be a root protection circle at 15 times the stem diameter of the tree. Depending on the radius of the tree canopy, a second RPA may be drawn representing the canopy of the tree plus a 5m buffer.
Tree Details -> Branch Spread – this is shown as a coloured polygon around the tree. It is determined by the 8 Branch Spread fields on the Tree Details. Enter as a minimum either all 4 cardinal points (N, S, E & W) or the 4 intercardinal points (NE, SE, SW, NW).
Root constraints – use this layer to draw simple polygons to denote areas that would influence the spread of roots, such as buildings or bodies of water.
Hedges – these are drawn as a line through the middle of the hedge. In the details, specifying the Hedge Width field will change the width of hedge. The width measurement is the total width of the hedge. You can specify multiple species that make up the hedge.
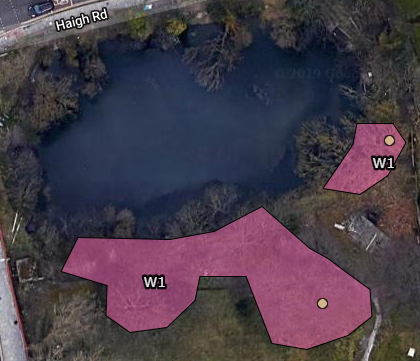
Woodlands – draw a polygon to represent woodland, being sure to complete the polygon. If you have multiple areas of woodland that have the same mix of species, you can say yes to add another polygon to the same unique reference number.
Groups – draw polygons to represent groups of the same tree species.
Woodland stems – trees of interest within the woodland area. These are not given a reference number and just appear as a point within the woodland.
Group stems – trees of interest within the group area. These are not given a reference number and just appear as a point within the group.
Background layer – tick this to remove all maps and topo drawings and simply show a white background layer enabling you to easily see the assets. If you would like to see the topo drawings as well, instead change the base map to a paler option, like OpenStreetMap Light. You may also use the transparency dial to make the background layer more or less transparent.

Reference layers – these are your CAD imports. Tick the box to display the layer. You may need to zoom in to see the detail.
Reference layers Snap To – turn this on by toggling the Snap To button to turn it green. Whilst on, it will make plotting features easier by ‘snapping’ the cursor to the lines in the reference layer. Toggle it back to grey when not in use.
Colour Coding – the colour of each component is determined by the Quality Category:
- Quality A – Green
- Quality B – Blue
- Quality C – Grey
- Quality U – Dark Red
- Incomplete data – Pink
Exporting to CAD – go to Hub -> Data Tools -> Exporter and click on the Export Survey to CAD button.
NB If you archive a survey, note that you’ll need to unarchive it before adding new assets to it for the numbers to be entered sequentially (otherwise you’ll get another T1 or G1)