Learn how to create a detailed report of your TreePlotter INVENTORY™ data in chart form.
Topics covered in this tutorial:
- Navigating to Chart Reports
- Chart Report features
- Interacting with Chart Reports
Navigating to Chart Reports:
- Navigate to the HUB > Reports
- Select “All Charts” or the charts from the “Dashboard”.
- Give the report a title. Check the “Use Applied Filter” tick box to restrict the results to the filter currently in use.
- Click the ‘Run Report’ button.
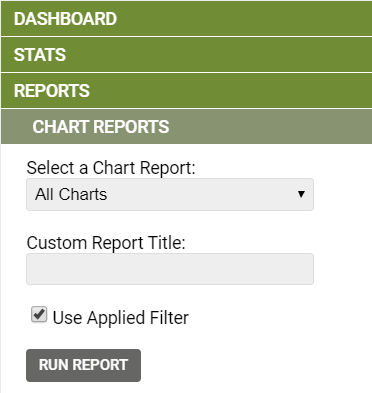
Chart Report Features:
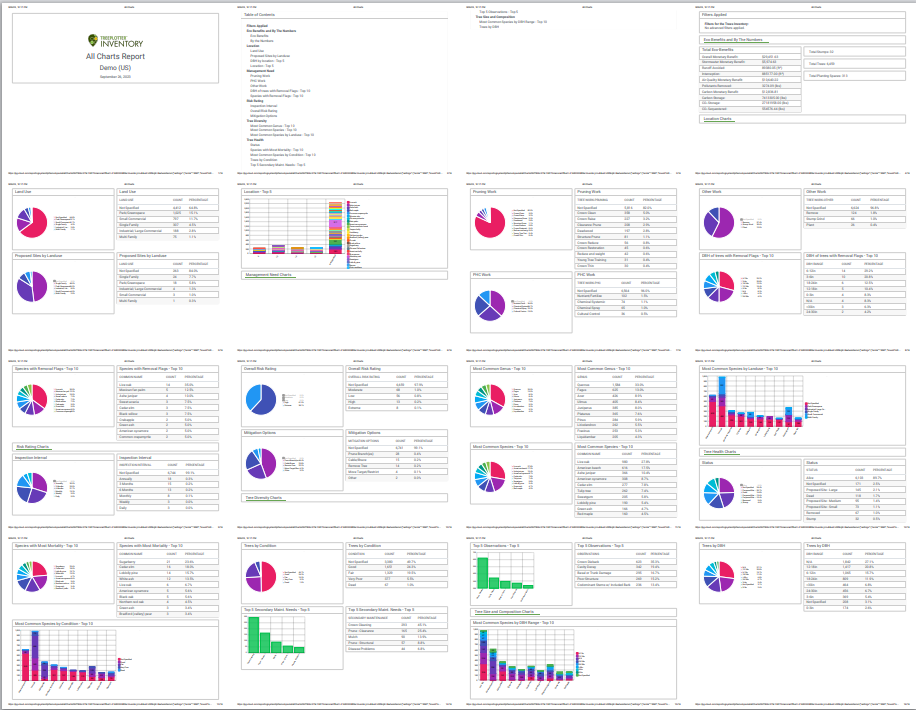
- The Chart Report includes
- Cover page
- Table of contents
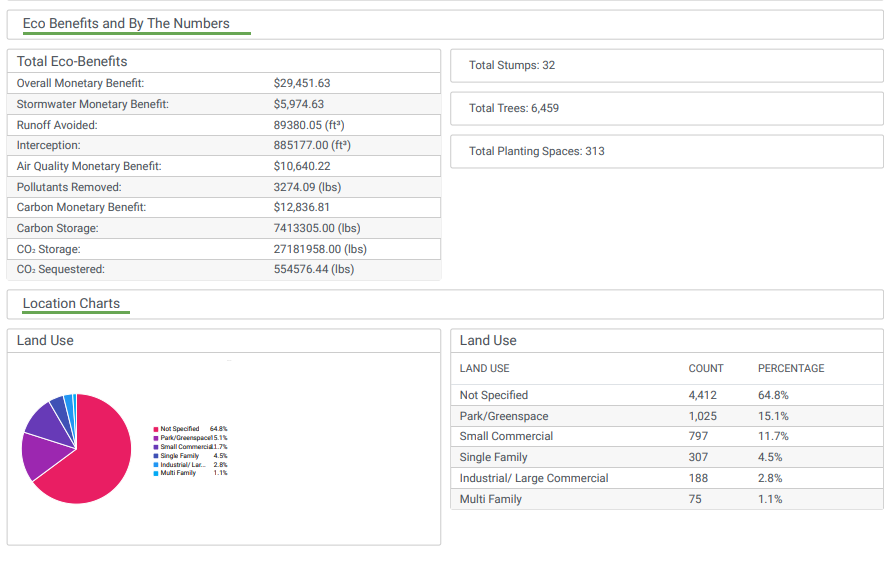
- All charts and graphs or the charts/graphs found in the Dashboard.
- All charts pull from the data held in Tree Details.
- For each chart there is an optional notes section to add comments.
Interacting with Chart Reports:
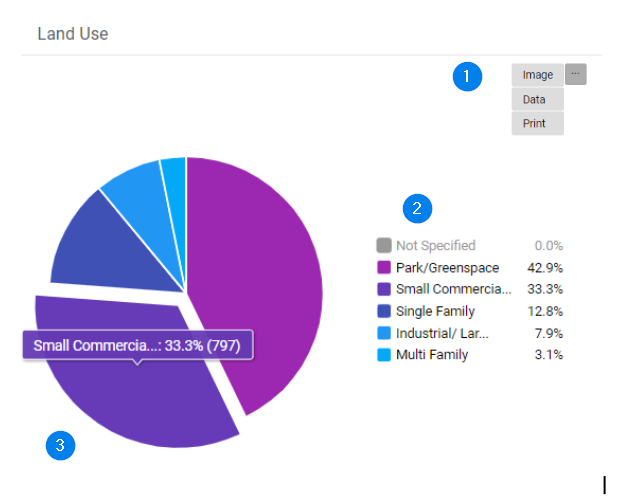
- Click on the ellipsis to download the image of the selected chart, export the data, or print the chart.
- Click on the value in the legend to remove it from the chart. In this example, “Not Specified” is grey to show that it is excluded from the chart’s figures.
- Click on a particular chart segment to draw attention to it.