
Use this tool to keep your favorite TreePlotter™ charts and graphs in one place!
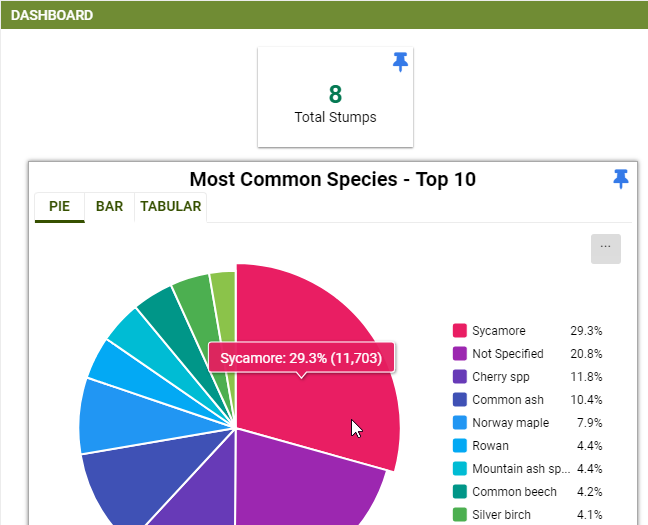
There are many charts and graphs under Hub -> Stats -> Charts and Graphs. Click on the pin against a chart to save it to the Dashboard. The color of the pin changes to blue once it has been added.

To remove a chart or graph from the dashboard, click the pin again and see that it goes back to grey. You can click the pin either from the dashboard or from Charts and Graphs.
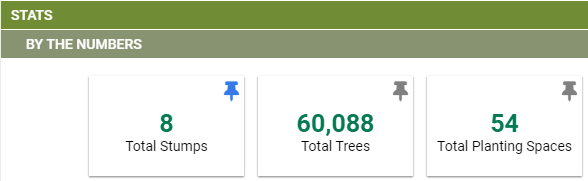
You can even add some or all of the summary figures under By The Numbers.
To get to the dashboard, click on Hub and select Dashboard from the menu:
See Reports: Chart Reports for information on printing the charts and graphs in the dashboard as a report.
Note: Only Admin users can add or remove items from the dashboard.