
The “Land Cover / Tree Equity Data Pack” consists of reference layers with data attributes that offer additional metrics for equitable urban forest project planning. Historical Redlining Areas are encoded with the redlining classification attribute, canopy cover and land cover classification percentages. (Note: this features is not available in all cities)
Topics covered in this tutorial:
- Data Definitions and Sources
- Visualizing the Data
- Using the Tools
- Assessing the Metrics
Definitions and Sources
Historic Investment Worthiness: Historically neighborhoods were ranked Best, Still Desirable, Declining, Hazardous, as well as Commercial/Industrial for banks and other mortgage lenders to determine the risk of investments in a given neighborhood. People in neighborhoods with greater perceived risk by lenders received higher interest rates or were denied loans altogether based on proportion of residents who were African Americans or, to a lesser extent, immigrants or Jews. The Justice40 Canopy Layers tools allow users to visualize areas which have historically received disproportionate equity.
For more information visit the Redlining – Mapping Inequality website
Land Cover Classifications: These features can be used to investigate areas disproportionally in need of Urban Tree Canopy which may have an affected on urban heat, pollution, and health. These land cover statistics can be used to identify areas with unequal distribution of Urban Tree Canopy. Lack of healthy tree canopy in urban areas contributes to the impacts of excessive heat, pollution, and climate change.
For more information visit the Land Cover Product website
Visualizing the Data


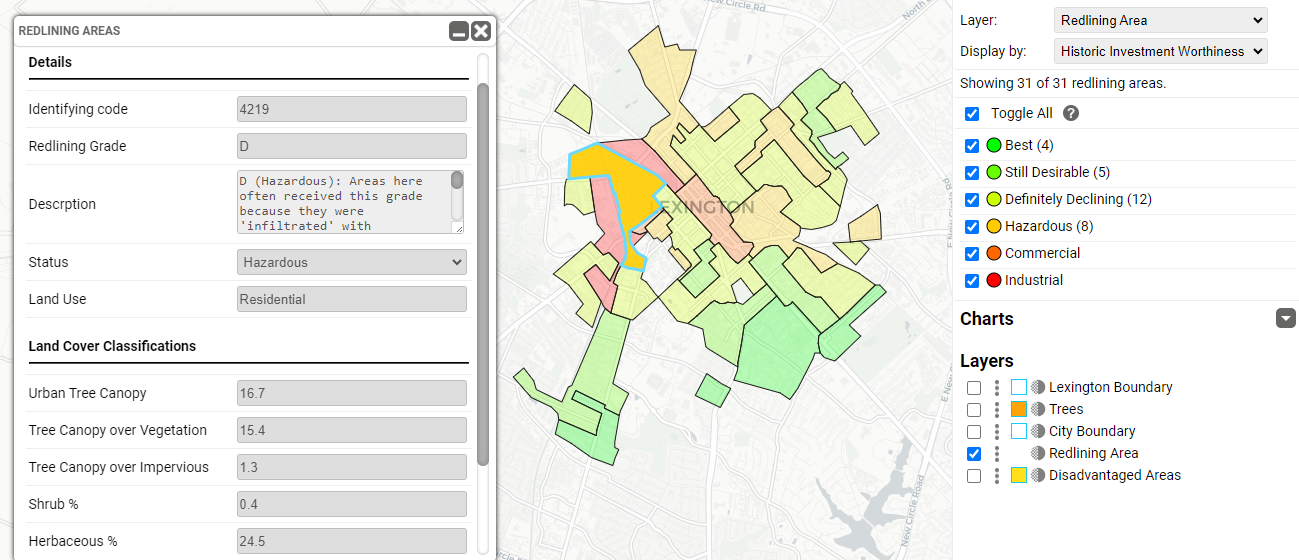
To view the Historical Redlining Areas on the map navigate to the ‘Layer’ dropdown within the Interactive Legend.
From here you can toggle between available fields with the ‘Display by’ drop down menu feature.
Using the Tools

Use the Slide Bar or Check Boxes to isolate Historical Redlining Areas based Urban Tree Canopy or Historic Investment Worthiness.
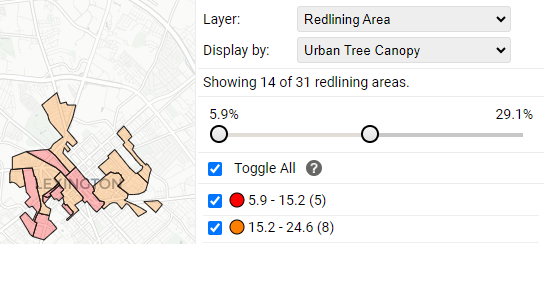
In this example the Slider Bar was used to isolate Historical Redlining Areas with below average Urban Tree Canopy.
Accessing the Metrics
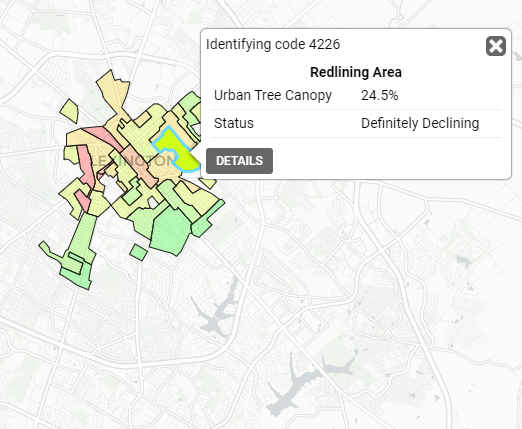
Selecting a Historical Redlining Area on the map to view the Urban Tree Canopy, Redlining Status, and the ID number for reference.
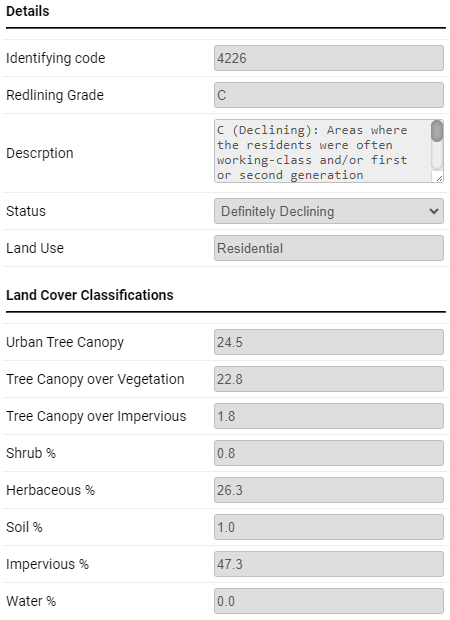
From the popup window press ‘Details’ button to access additional definitions and Land Cover Classification metrics.
Known Limitations:
- This features is not available in all cities.
- Land cover data are limited to only the combined area of disadvantaged areas and any redlining areas which are present. The sum total of these areas is not representative of the land cover distribution of the full city.
- Redlining grades A & B are areas that were historically favored for investment and therefore more likely to have infrastructure improvements, like well maintained public trees.
- These data are intended to be used as guides for identifying areas which are likely experiencing disproportionate environmental burdens they should be used in partnership with local community knowledge and lived experience.
Potential Next Steps:
- Collect planting sites within disadvantaged areas
- Generate Reports of existing inventory