
The “Land Cover / Tree Equity Data Pack” consists of reference layers with data attributes that offer additional metrics for equitable urban forest project planning. The Climate and Economic Justice Screening Tool (CEJST) Disadvantaged Areas are encoded with all 8 CEJST disadvantage thresholds, canopy cover and land cover classification percentages.
Topics covered in this tutorial:
- Data Definitions and Sources
- Visualizing the Data
- Using the Tools
- Assessing the Metrics
- Viewing Land Cover by Census Block
Definitions and Sources
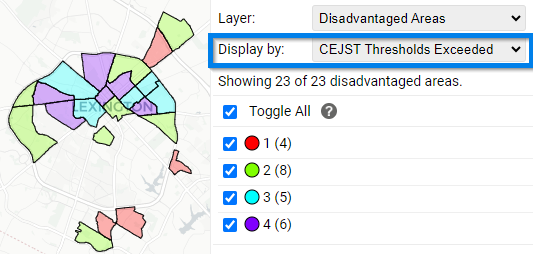
Number of Climate and Economic Screening Tool attributes exceeded: There are 8 thresholds used as indicators of burdens including: Climate Change, Energy, Health, Housing, Legacy Pollution, Transportation, Water/Wastewater, and Workforce Development. The Justice40 Canopy Layers tools allow users to visualize the number of thresholds exceeded for each Disadvantaged Area.
For more information visit the Climate and Economic Screening Tool website.
Land Cover Classifications: These features can be used to investigate areas disproportionally in need of Urban Tree Canopy which may have an affected on urban heat, pollution, and health. These land cover statistics can be used to identify areas with unequal distribution of Urban Tree Canopy. Lack of healthy tree canopy in urban areas contributes to the impacts of excessive heat, pollution, and climate change.
For more information visit the Land Cover Product website.
Visualizing the Data
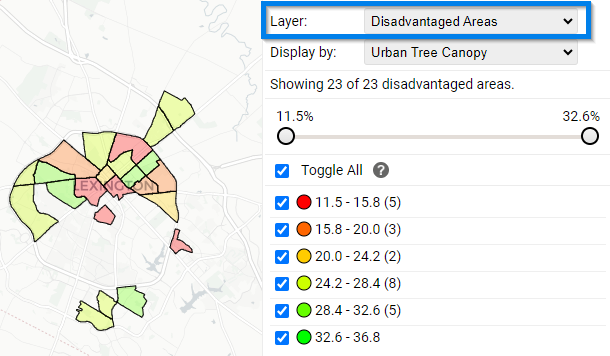
To view the Disadvantaged Areas on the map navigate to the ‘Layer’ dropdown within the Interactive Legend.
From here you can toggle between available fields with the ‘Display by’ drop down menu feature.
Using the Tools
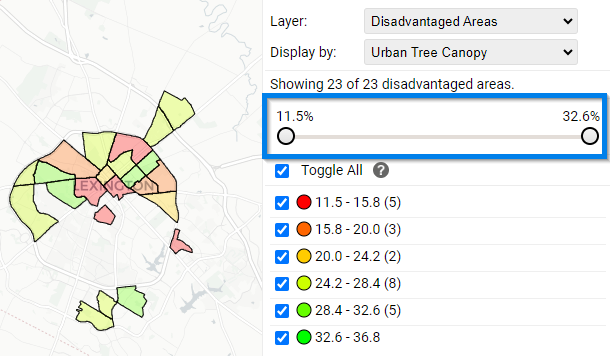
Use the Slide Bar or Check Boxes to isolate Disadvantaged Areas based Urban Tree Canopy or Number of Exceeded CEJST Thresholds.
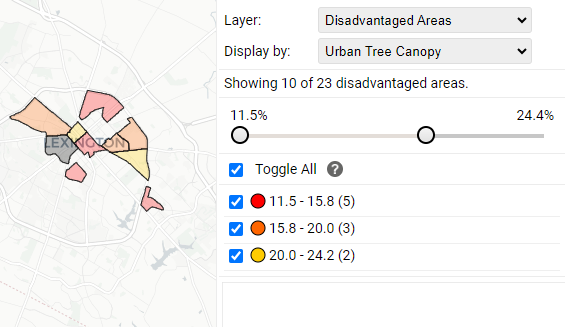
In this example the Slider Bar was used to isolate Disadvantaged Areas with below average Urban Tree Canopy.
Accessing the Metrics
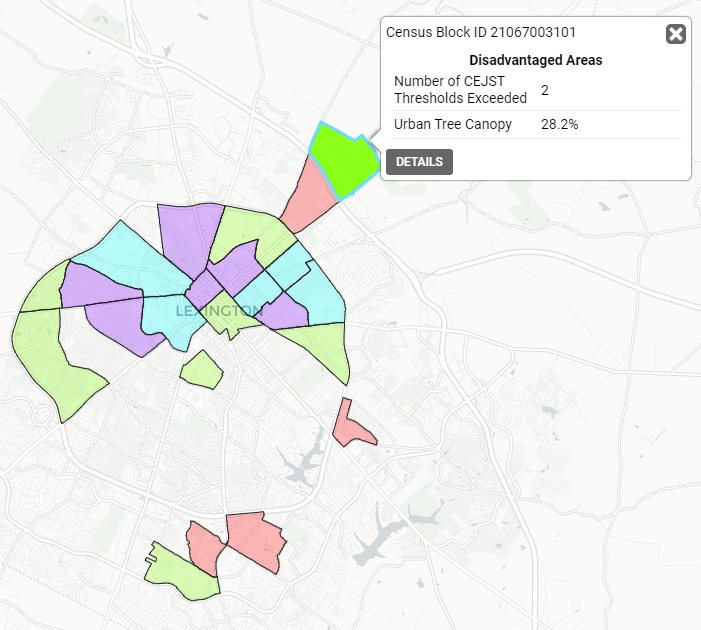
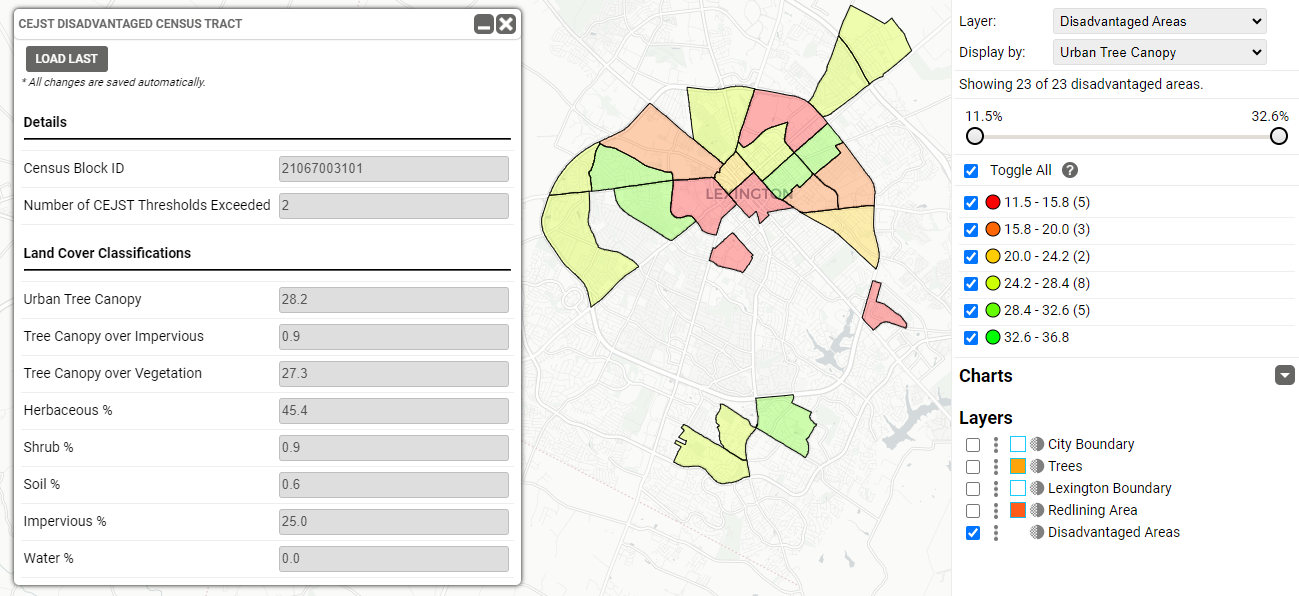
Selecting a Disadvantaged Area on the map to view the Urban Tree Canopy, Number of Exceeded CEJST Thresholds, and the Census ID number for reference.

From the popup window press ‘Details’ button to access additional Land Cover Classification metrics.
Viewing the Land Cover at the Census Block Level
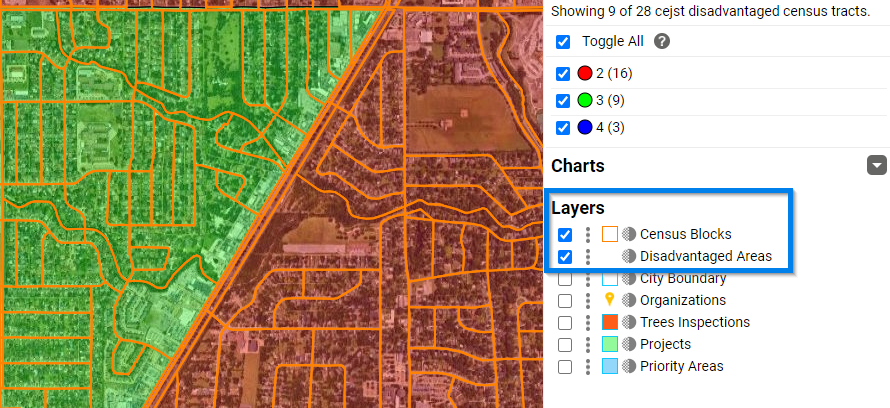
Overlay the Census Block boundaries with the CEJST Disadvantaged Areas by checking the “Census Block” reference layer from the bottom of the legend.
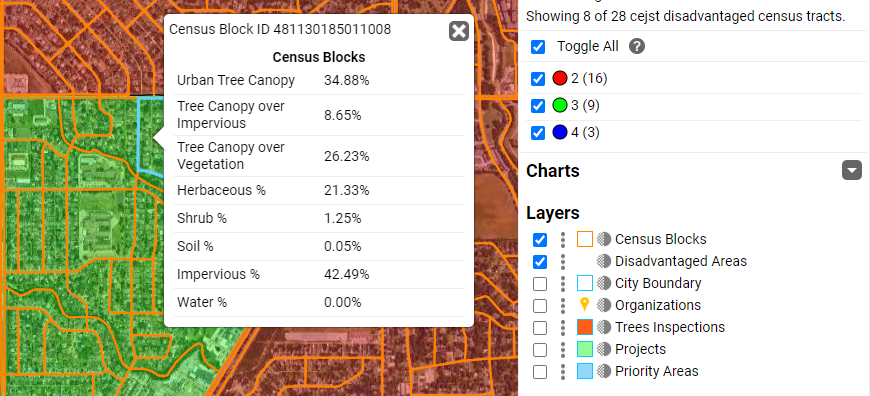
Select a Census Block area to view the Land Cover metrics within its boundaries. (Note: CEJST data, and color coding are not available at this scale)
Known Limitations:
- CEJST is the default standard for identifying communities where environmental burdens are disproportionate. Areas shown on the map are considered disadvantaged and disproportionately burdened by environmental stresses.
- Other means of demonstrating socioeconomic disadvantage and environmental burden exist (EJ Screen, State level Enviroscreen Tools). CEJST should be a first step and local knowledge will often be more accurate and up-to-date than national scale datasets.
- Land cover data are limited to only the combined area of disadvantaged areas which are present. The sum total of these areas is not representative of the land cover distribution of the full city.
Potential Next Steps:
- Collect planting sites within disadvantaged areas
- Generate Reports of existing inventory