Overview:
The TreePlotter CANOPY ™ plan tool allows a user to target and prioritize areas that are most suitable for tree canopy growth based on demographic, socioeconomic, and environmental criteria. Tree planting and increased tree canopy can address issues such as stormwater mitigation, energy conservation, air quality, human health, and unequitable access to trees and their benefits.
The plan tool allows a user to visualize the areas of their city that would receive the most benefits from increased tree canopy based on selected criteria. Each selected criteria can be weighted high, medium, or low based on the user’s needs. In most cases, the plan tool is only compatible with U.S. Census Bureau geographic assessment boundaries, the most common being Census Block Groups.
Instructions to Use the View Tool:
Step 1 – Select a Geography:
Select the geographic boundary of interest by using the block drop-down arrow. Only U.S. Census Bureau assessment geographies can be viewed in this tool. Once chosen, the selected geography will be displayed on the map. This example shows Census Block Groups as the chosen assessment scale.
Step 2 – Select Prioritization Criteria and Set Weights:
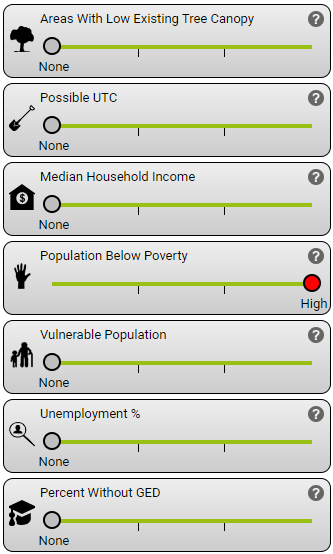
By selecting the desired prioritization criteria and the specific weight, a user can control which criteria are used to prioritize areas for new tree planting and how much influence each criteria has on determining which areas are the most suitable for new tree planting. All criteria weights can be changed at once using the None, Low, Medium, and High buttons found at the top of the section. Individual weights can also be adjusted using the specific criteria slider bar. To remove a criteria, simply set its weight to None. By default, all criteria weights are set to Medium. More information on how each prioritization criteria was created can be found in the next section or viewed within the software by hovering over the question mark icon next to each criteria. To learn more about the Plan criteria, click here.
Step 3 – Filter Data:
Click and drag the toggle on the Filter
by Site Suitability slider bar. As a user slides the toggle to the right, a filter is applied to the data, and areas that are less suitable for new tree plantings based on the selected and weighted criteria will be removed from the map leaving
only the most suitable areas.
Understanding Your Map:
The plan tool will display your map according to Site Suitability. Site Suitability is how suitable the area is for planting more trees. The plan tool will produce Site Suitability by weighing ecological and societal benefits using specific Plan Criteria.
The greater the suitability of an area for planting additional trees, the deeper the shade of red it will exhibit. Areas classified as having Medium Site Suitability will appear orange, while those with Low Site Suitability will be depicted in green.
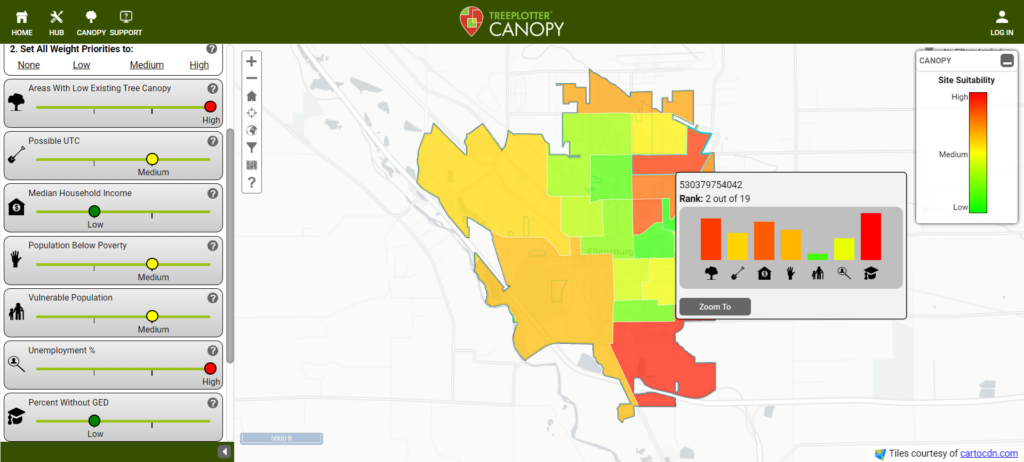
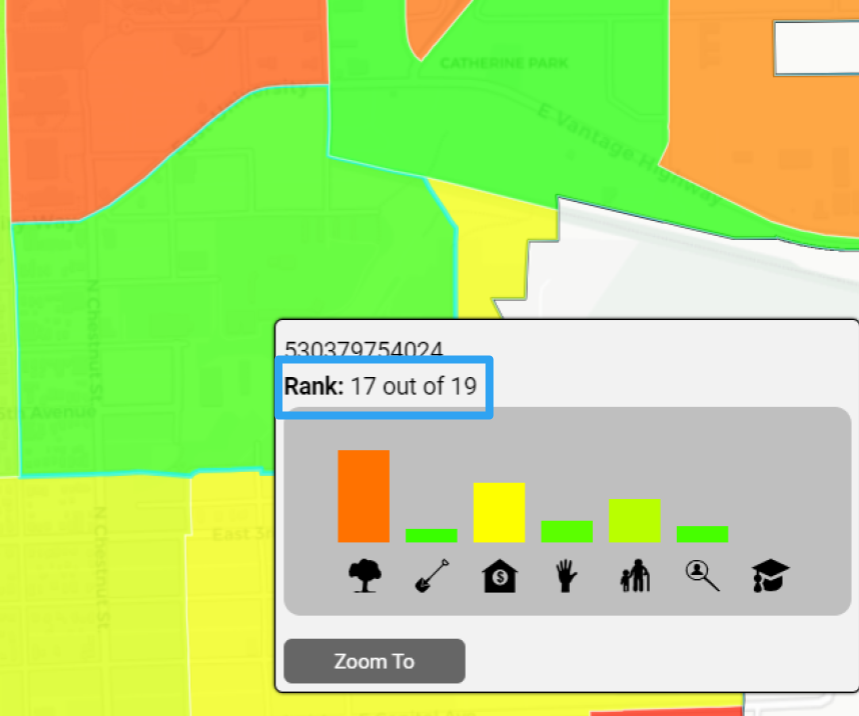
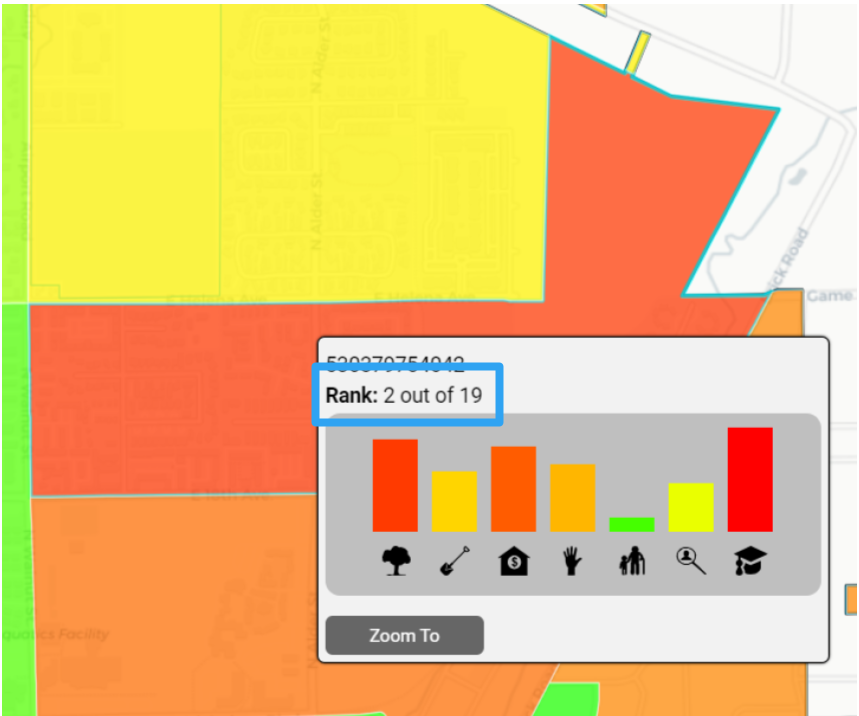
Selecting a feature: To view the unique prioritization criteria for a specific feature on the map, click on that feature. A pop-up will display all the relevant data, and the selected area will be highlighted in bright blue. (Seen in example above)
An area with a Site Suitability of 1 will have the highest rank in Site Suitability and be the best area for planting more trees. If the rank is a higher number, the ranking will be low, and mean a lower Site Suitability. If the rank is a lower number, the ranking will be high and have higher the site suitability. Also in the pop up, there will be Plan Tool Criteria displayed in a bar graph format.
By hovering over a criteria of interest, you can get the metric for that criteria.
Using the Weight Priorities:
Using the weight priorities, you can filter the polygons on the map to those that fit within the Plan Criteria meaning the most to your organization. Let’s use Population Below Poverty as an example here. You can isolate more than one Plan Criteria metric, however, for this example we will only be using one.
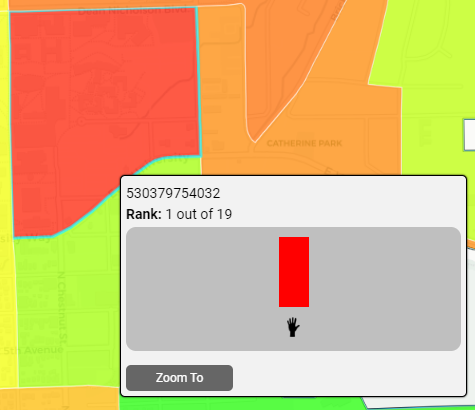
First, set all Plan Tool Criteria to none. Then, set only the Population Below Poverty to high.
Now on your map, you will see Site Suitability according to the Population Below Poverty Criteria only.
The Rank will change depending on the Criteria you have chosen. Only the one bar graph for Population Below Poverty or the Criteria selected will be available in the pop up.