
Within the Hub tool are several handy tools that will help you quickly view statistics and visual representations of your data.
Topics covered in this tutorial:
- Accessing the Stats tools
- By the Numbers
- Charts and Graphs
- EcoSystem Benefits
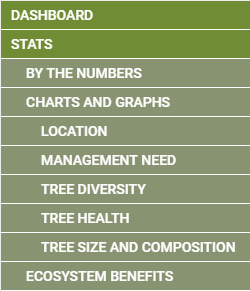
Accessing the Stats tools:
To Access the Stats tools go to Hub->Stat
By The Numbers:
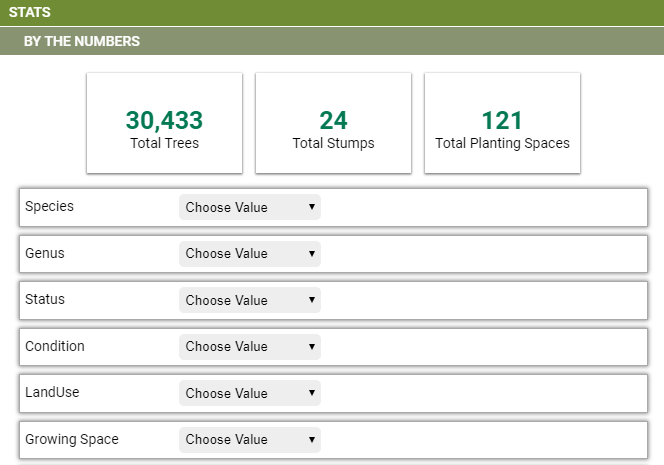
This tool is good for getting quick summaries of the data collected within your TreePlotter™ INVENTORY app. At the top of the tool are several bubbles with snapshots of the data. Here can be information like the total number of trees, total organizations, stumps, and planting spaces.
Below this will be several dropdowns which you can use to view counts and percentages of various attributes collected in the Tree Details form (Species, status, maintenance, condition, etc.). Please note that these are not compounded summaries. In other words, choosing “American Elm” under species and “Fair” under condition will not show the number of American Elms with a Fair condition. Rather, it will show the count of all American Elms in the app and a separate count of all trees with a Fair condition.
Charts and Graphs:
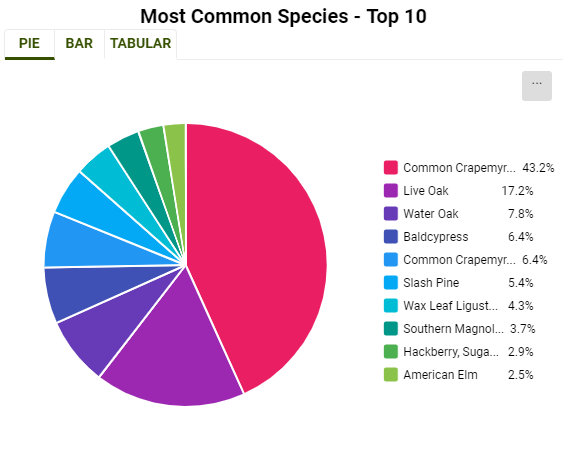
Here you will find several different tabs, all containing charts of various data collected in the Tree Details form. This information can include (but is not limited to) maintenance needs, location information, tree diversity, tree health, and size. Change the type of chart displayed by clicking on the “Pie”, “Bar”, or “Tabular” tabs at the top of the chart. To save the chart as an image file or print it, click on the small wrench at the bottom right of the chart. If Custom Charts has been activated for your app, it will appear here.
Ecosystem Benefits:
If you have the Ecosystem Benefits add-on module then you can view the statistics and savings here.